Home | Business Apps |
MENU

1.
Introduction
Reporting provides powerful insights into calls and interactions. It turns real-time and historical call data into clear, actionable metrics, helping you better understand performance, identify trends, and improve the customer experience.
Akixi’s call center reporting provides a wide range of real-time and historical reports to help:
- Identify service gaps
- Optimize performance
- Monitor patterns
- Make informed decisions
2.
Sign in to reporting
To access Akixi’s call center reporting:
- Go to: https://consolidated.akixi.com/
- Enter your Username and Password.
Note: Passwords must be at least 8 characters and include a mix of uppercase and lowercase letters, numbers, and symbols. The system blocks passwords that use common words, repeated characters, or simple sequences.
- Click Sign In.
Note: Depending on your license type, you may have limited access to reports and other elements covered in this guide.
3.
Account settings
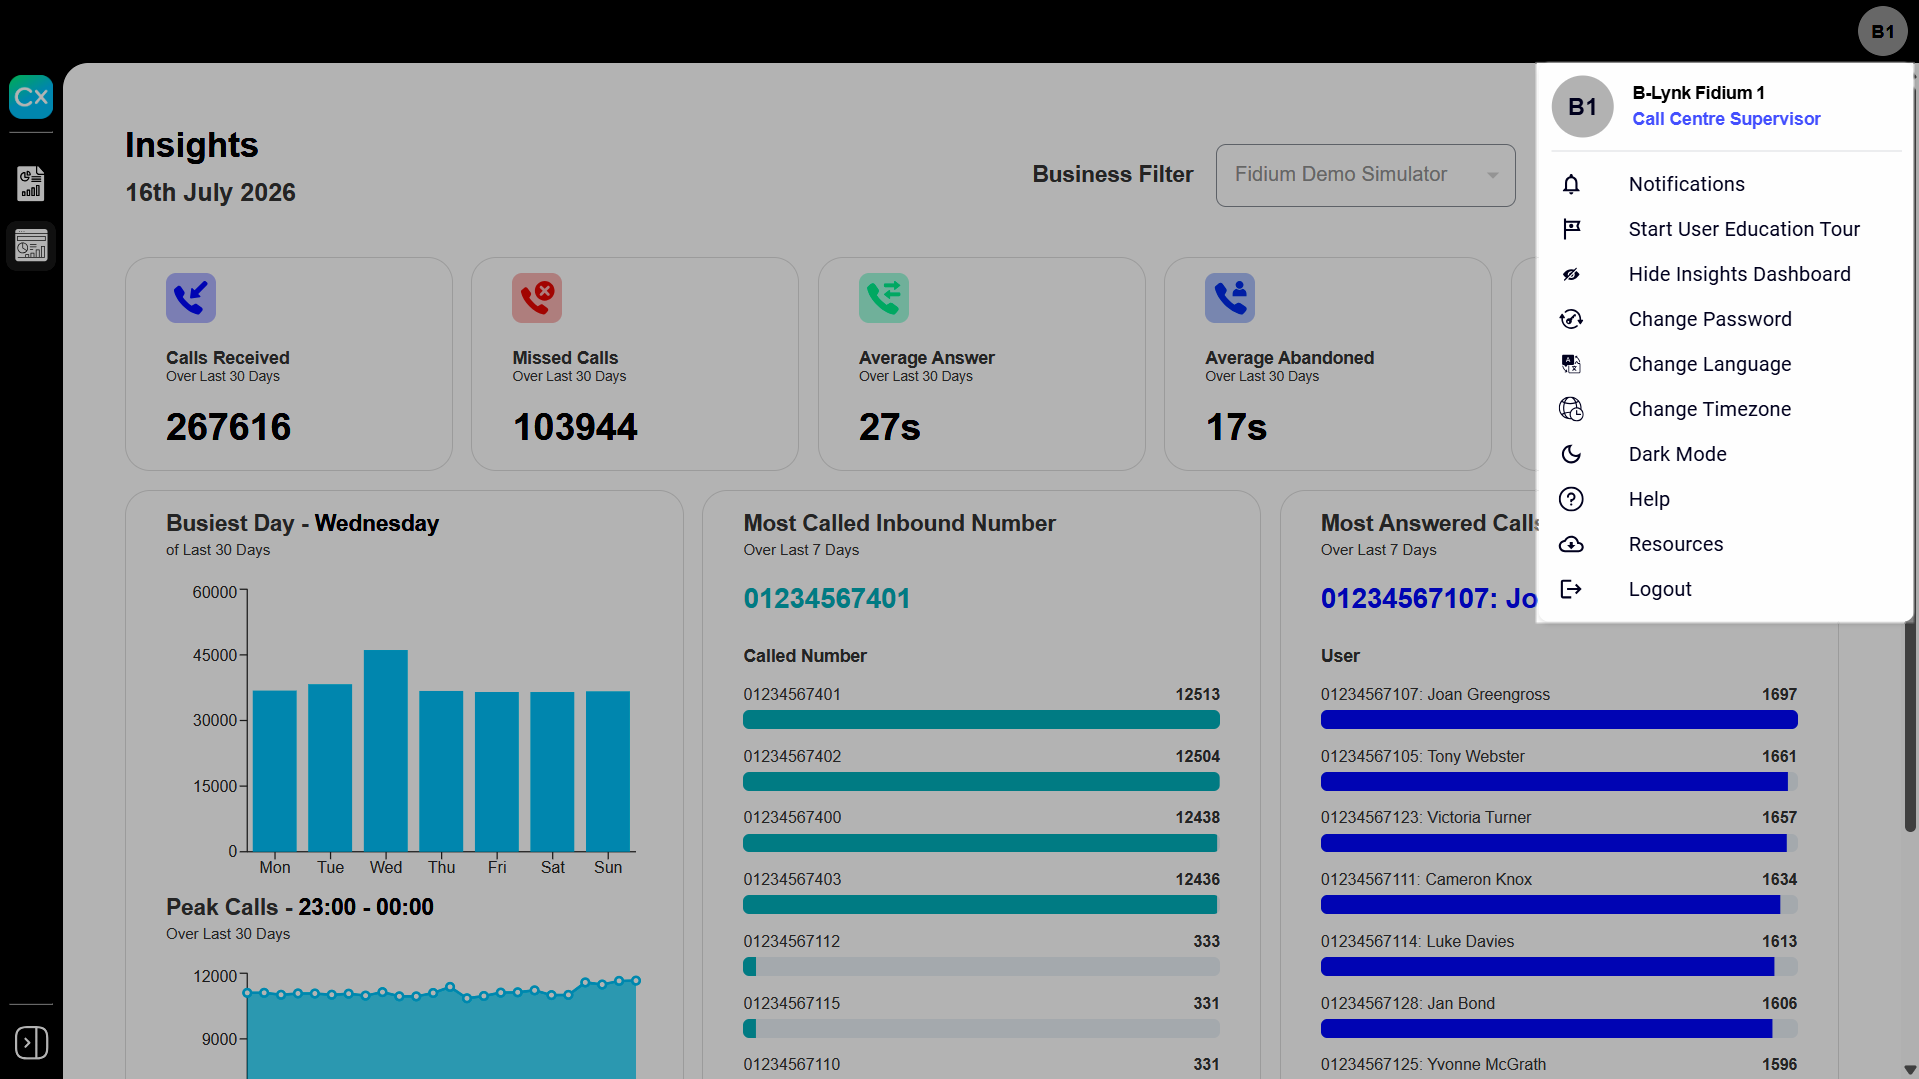
Click your profile icon to access account options and settings.
- Notifications - Manage your system settings and preferences.
- Start User Education Tour - Launch a guided walkthrough of the reporting interface.
- Show/Hide Insights Dashboard - Shows or hides the Insights dashboard.
- Change Password - Update your account password.
- Change Language - Set your preferred interface language.
- Change Timezone - Adjust how dates and times appear throughout your reports and dashboard.
Note: On sign-in, if your computer's time zone differs from the server's default, you're prompted to switch to local time. Accepting shifts every report timestamp accordingly — a call at 11:00 AM Central shows as 12:00 PM Eastern.
- Dark Mode - Switch the interface between light and dark display modes.
- Help - Open the online help resources.
- Resources - Open additional Akixi resources and links.
Select Logout to securely end your session.

4.
Insights and metrics
Insights provide a clear, data-driven view of overall performance, helping you identify trends, patterns, and opportunities for improvement.
To navigate to Insights, from the menu, select Insights.
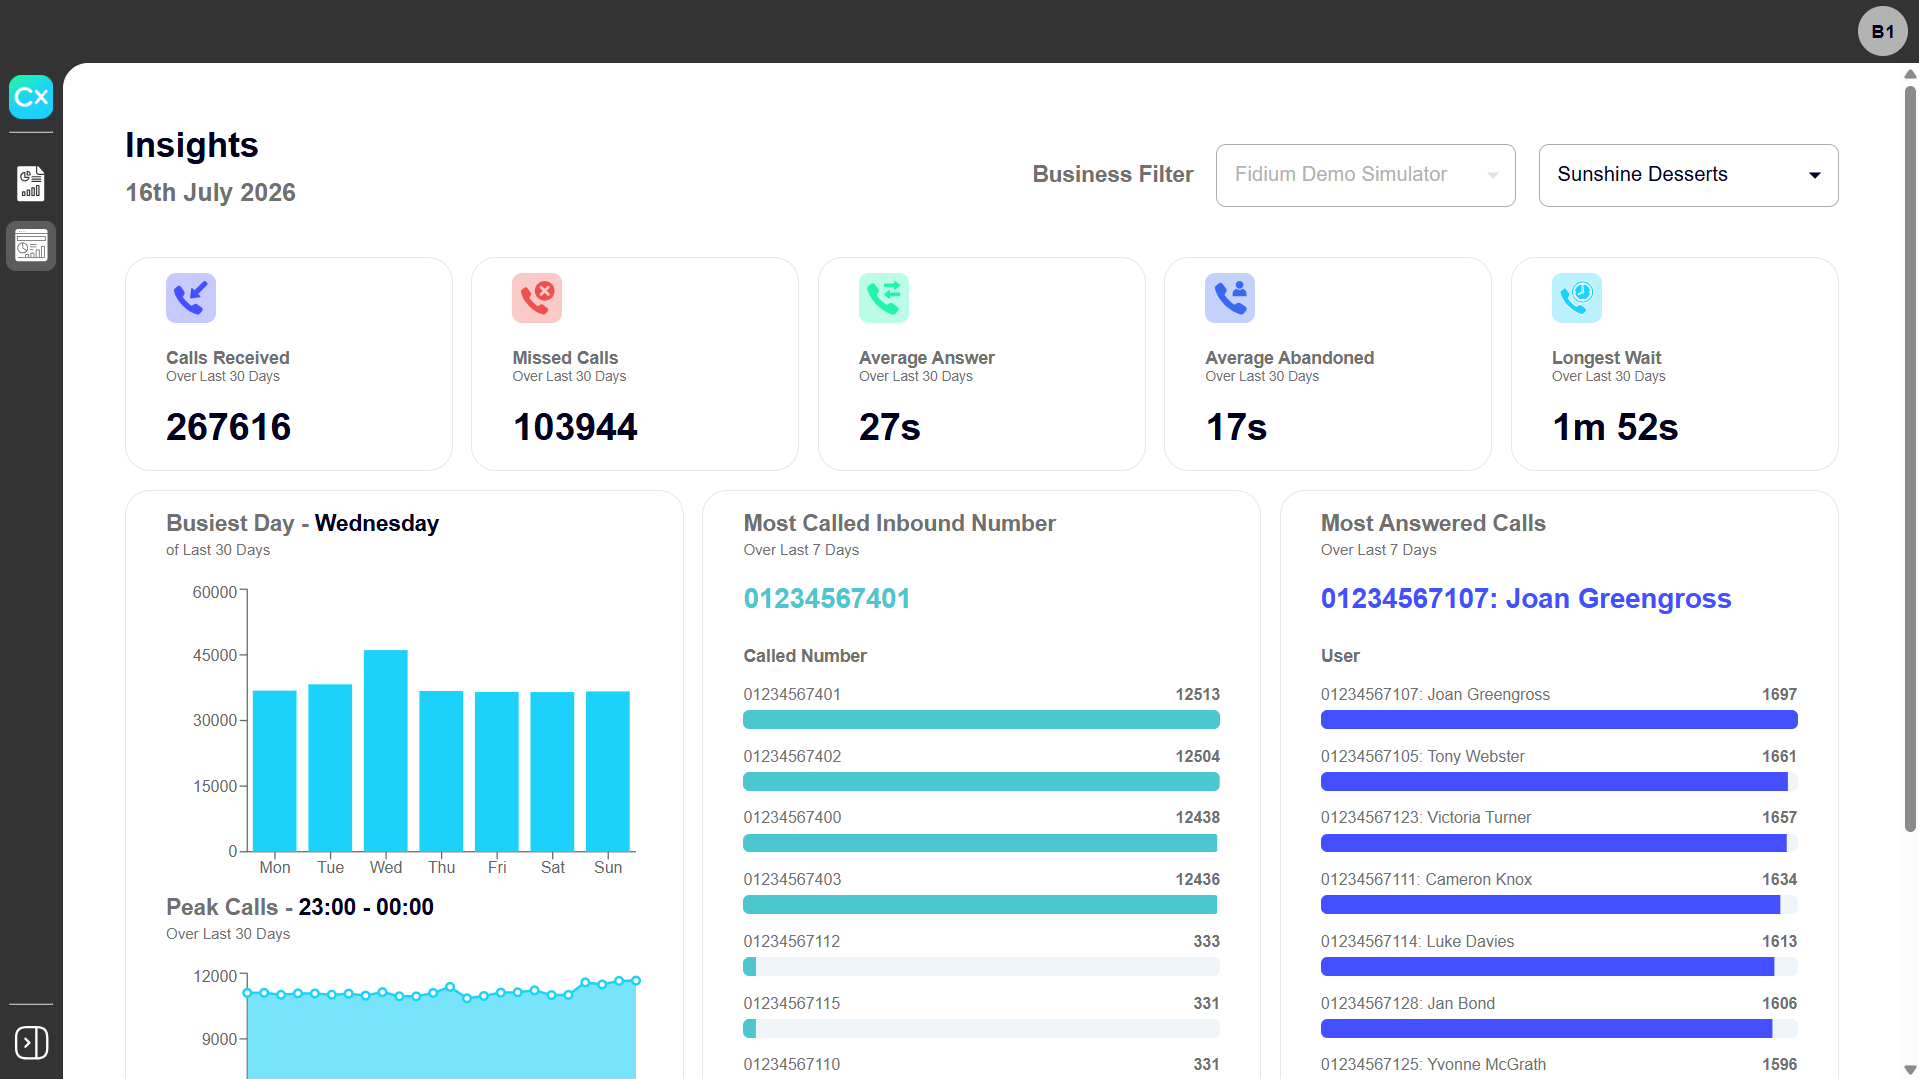
Key call performance metrics show data over the last 30 days for:
- Total number of calls received
- Missed calls
- Average answer and abandon time
- Longest wait time
Click any of the metric boxes to view additional call metrics showing weekly comparisons and trends.
5.
Navigate Analytics reporting
Use the Pin menu icons to lock the reporting sidebar on your screen.
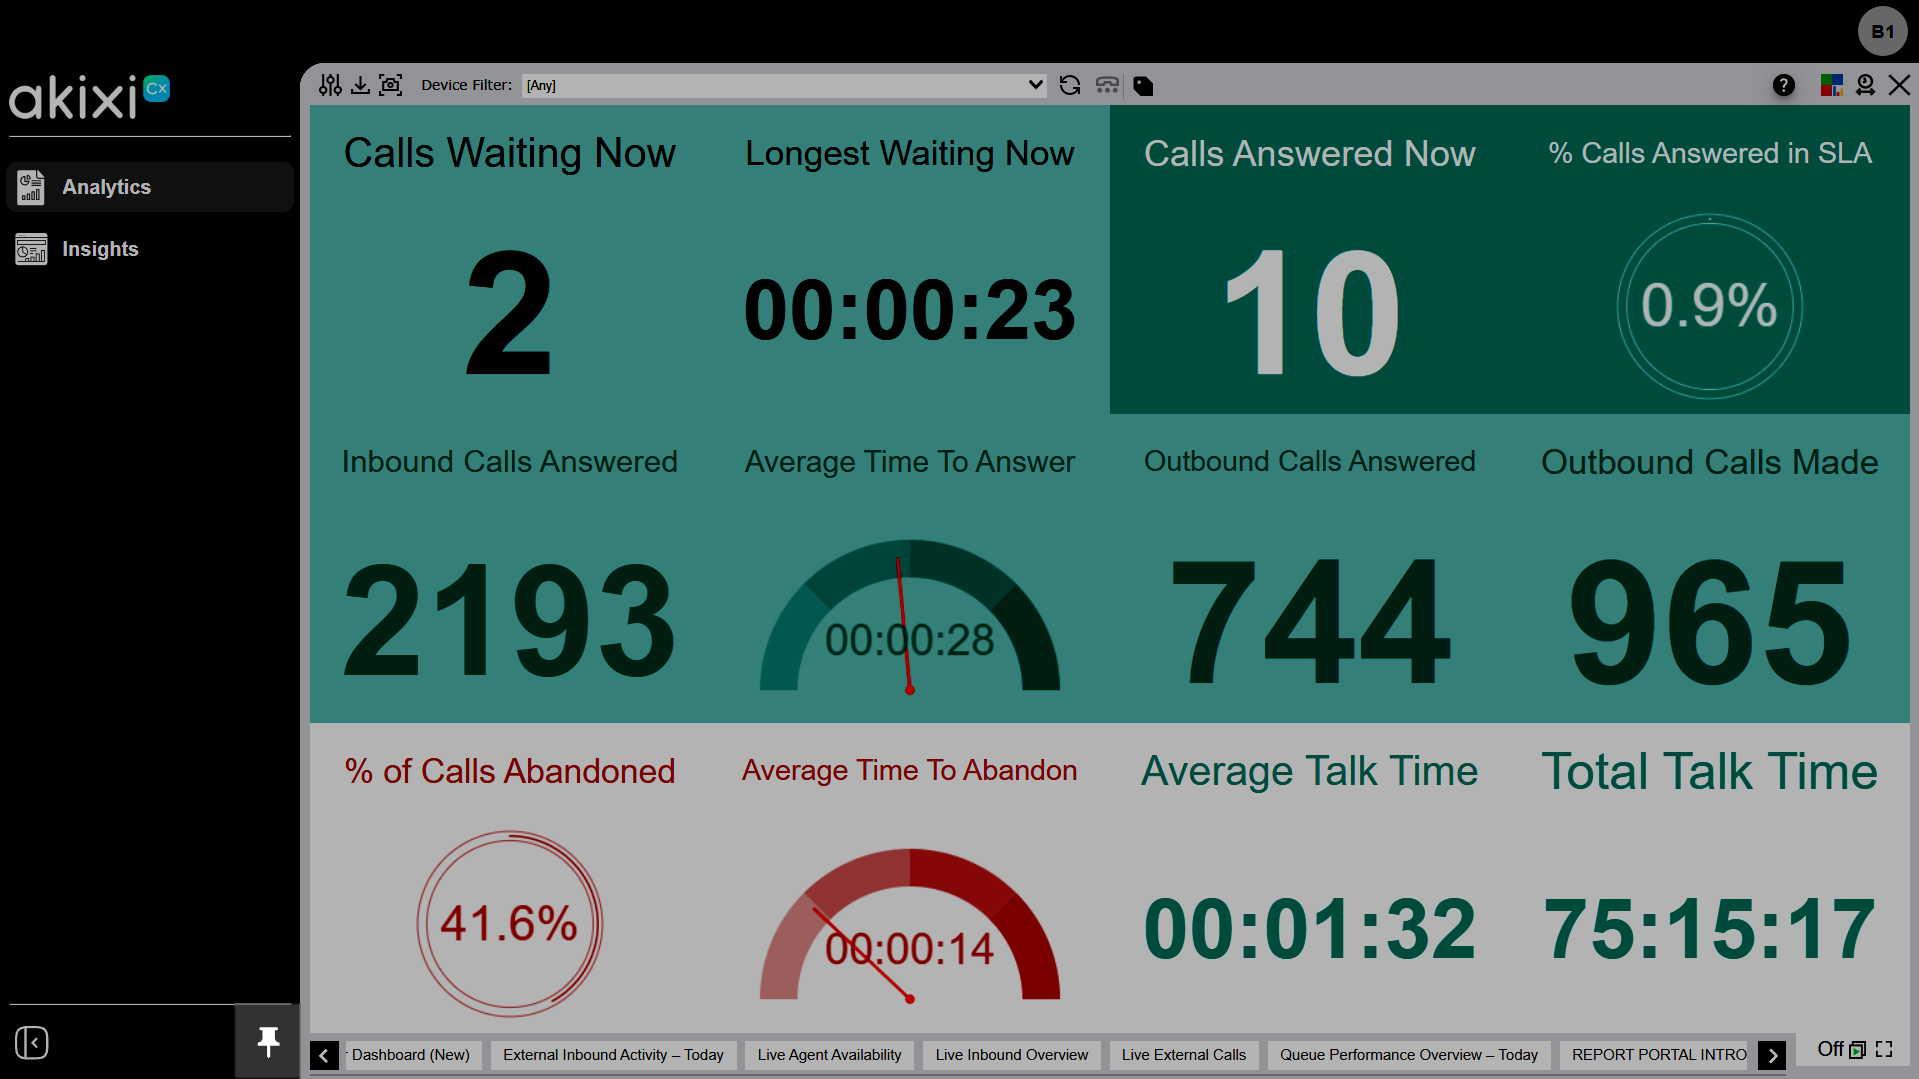
From the menu, select Analytics to view reports in your existing report library.
The active reports bar lists your active reports. Select a report to view it, or drag and drop reports to reorder them.
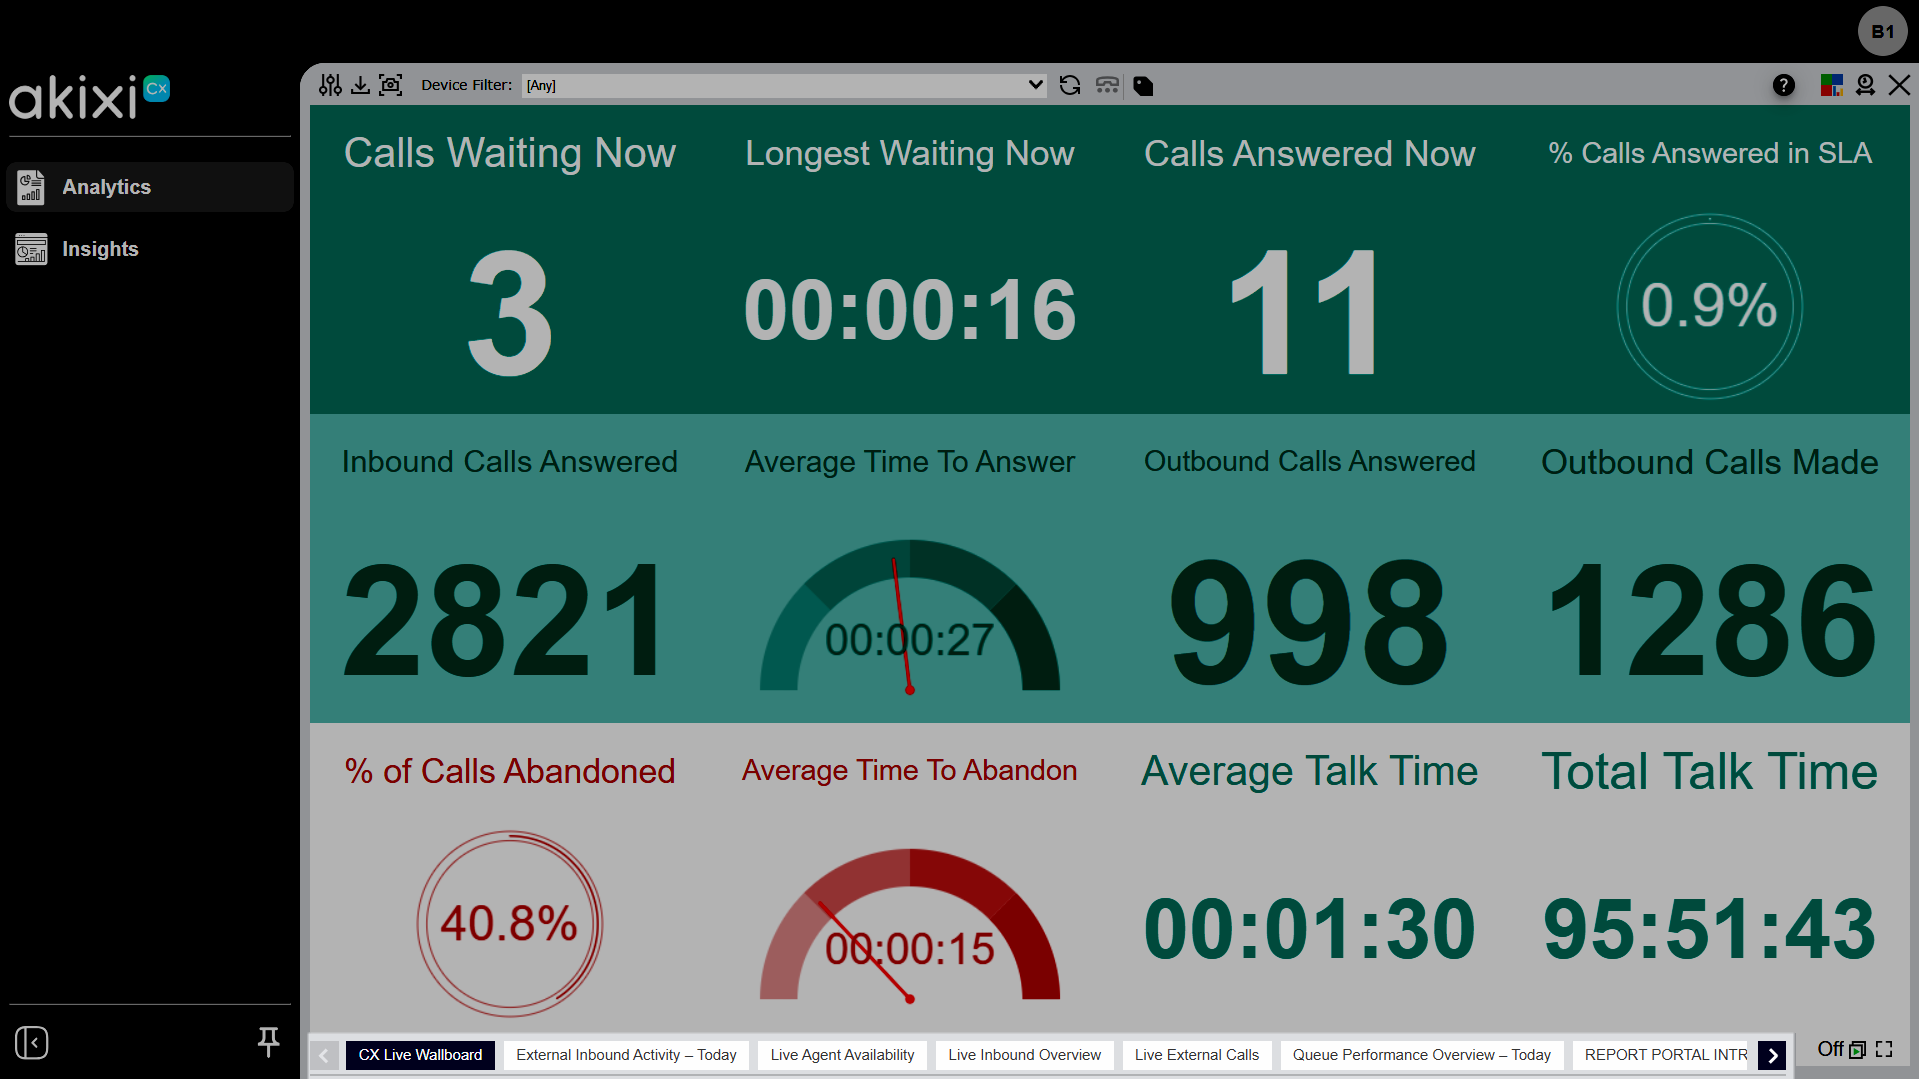
The following options are available in the reports menu.
- Pin the reporting menu.
- Collapse the sidebar to icons to free up space, then hover over an icon to see its label. Expand it again at any time.
- Add frequently used reports to Favorites for quick access from the top of the menu.
- Add a new report.
- Add a Default report.
- Copy a report.
- Delete a report. Deleted reports are held in the recycle bin for 30 days. To restore or permanently remove a report:
- Open the Recycle Bin.
- Select Restore to return a report to your repository, or empty the bin to permanently delete its contents.
Note: Restoring a modified default report returns the generic version — your customizations aren't recovered. Custom reports you created restore exactly as they were.
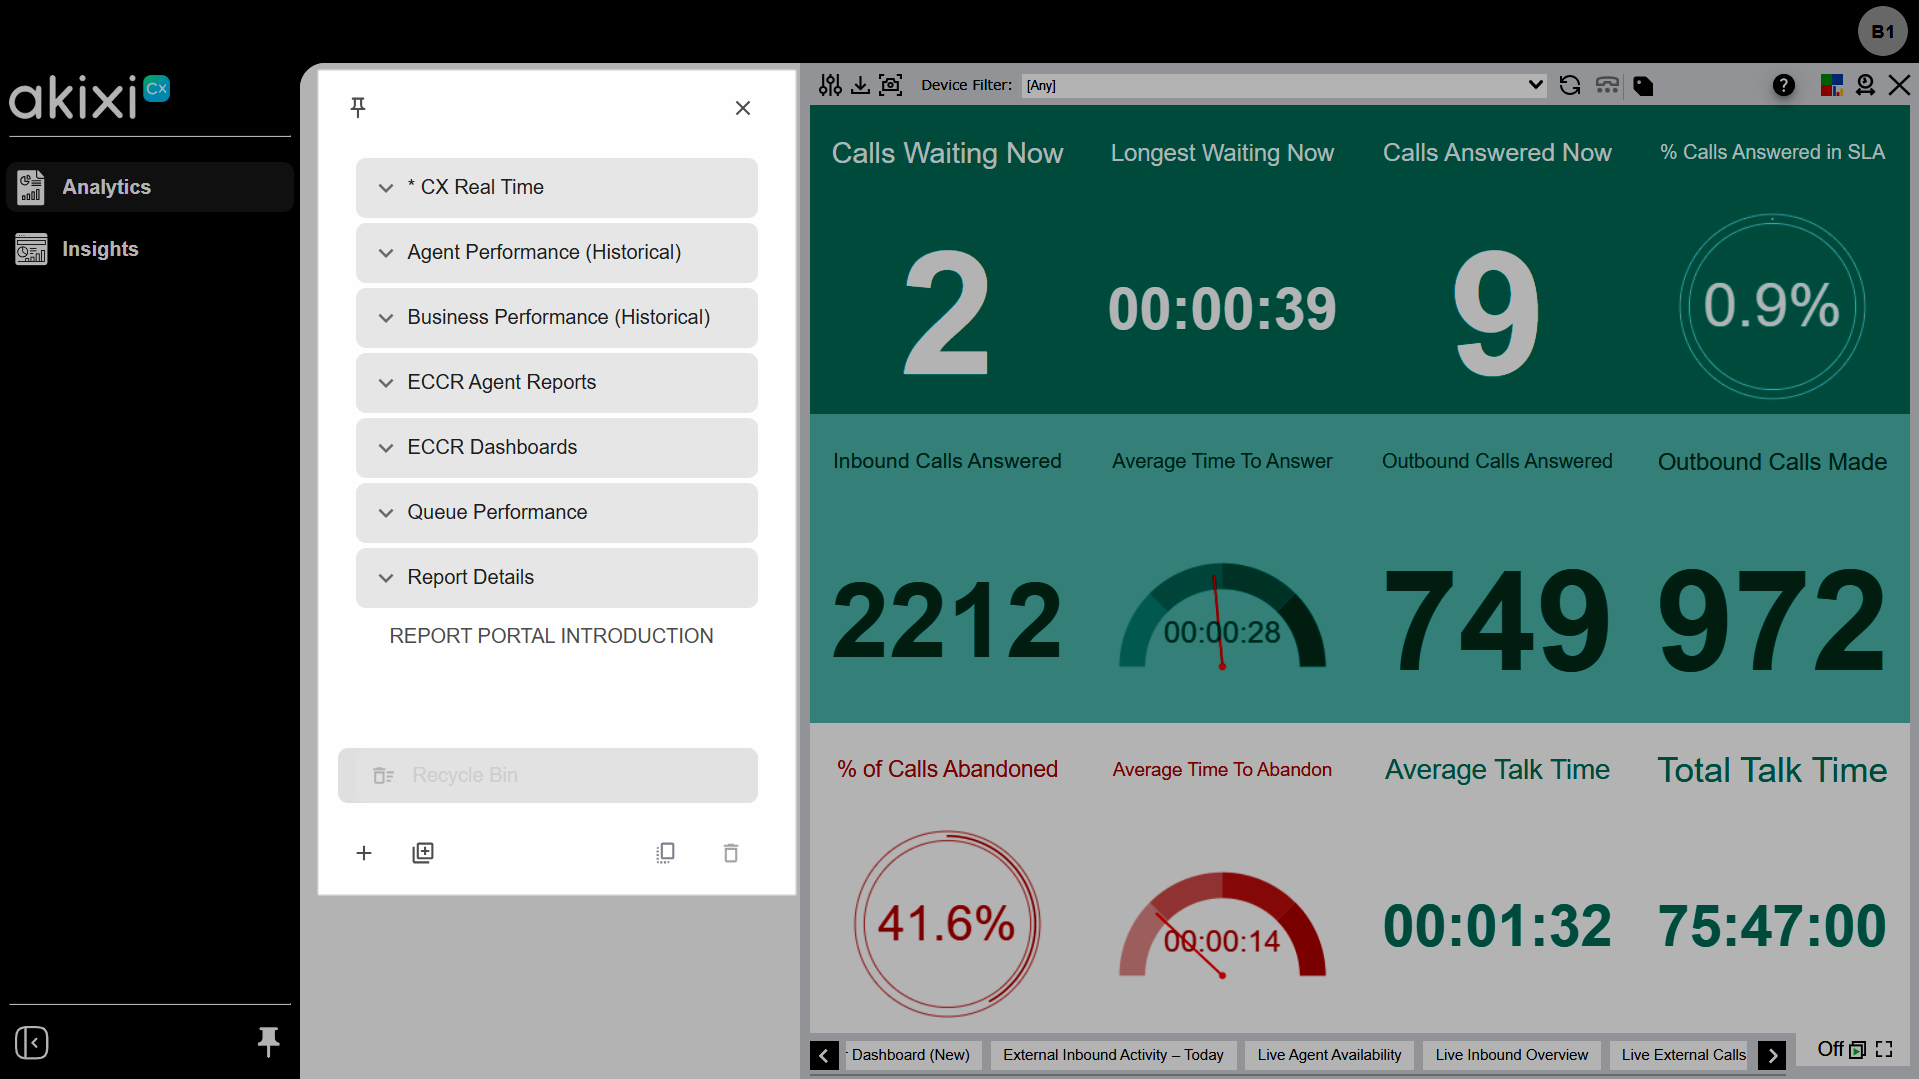
The icons in the report toolbar allow you to:
- Modify report filter parameters.
- Download a report.
- View a Snapshot of the report’s content in a new browser window.
- Apply a Device Filter.
- Re-run the report or apply newly specified filters.
- Adjust the Zoom Level for the selected report.
- Show all personal call control options.
- Set account codes for a call.
- Access the online help resources.
- Modify layout options.
- Change the date/time.
- Close the report.
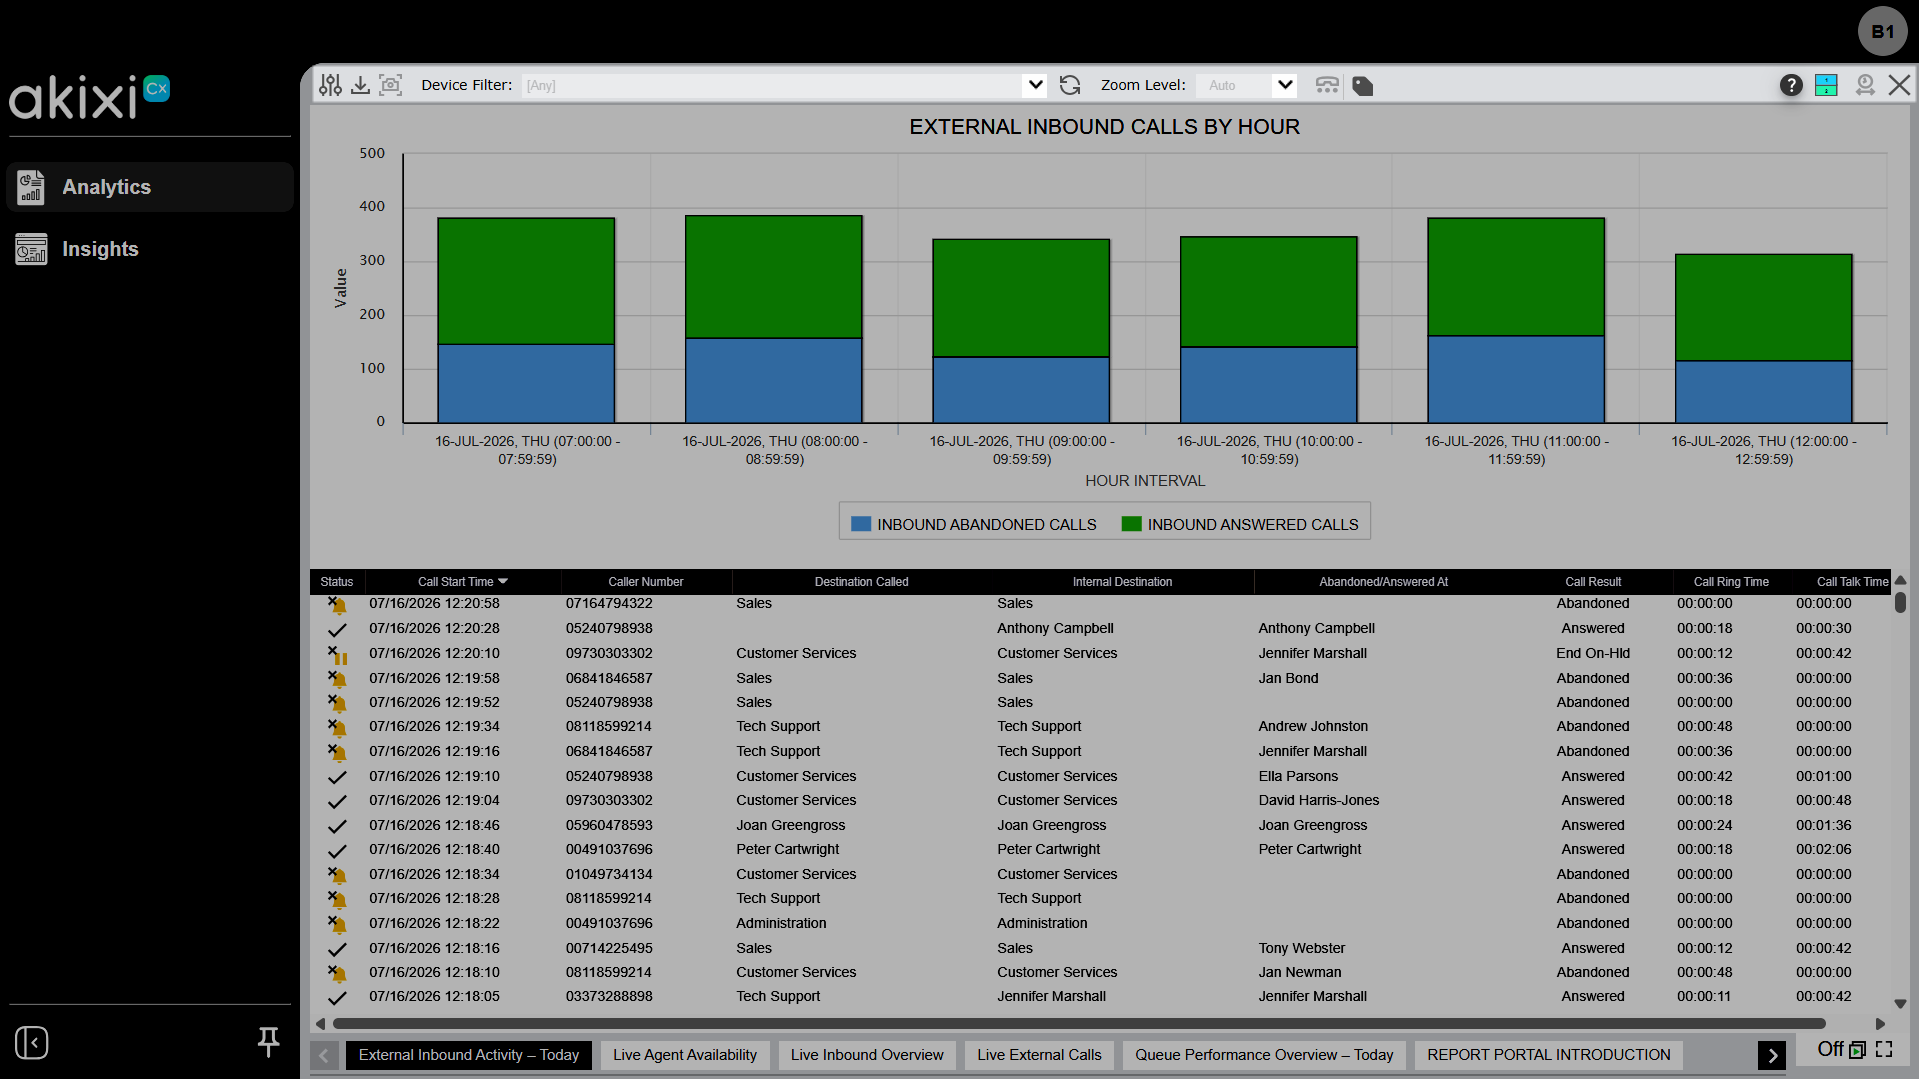
To open help, click the help icon or press F1. Help has been rebuilt for faster, more searchable answers.
- Context-sensitive help - Press F1 with a report open to jump to that report style's topic.
- Search and Ask - Search conversationally by keyword, or use Ask for a guided answer.
- More - Filter a topic by keyword, view platform callouts (e.g., BroadWorks vs. Webex), and export any article to PDF.
6.
Run and manage reports
Reports let you transform call data into meaningful insights by providing a clear view of call activity, agent performance, and customer interactions, helping you monitor trends, identify opportunities for improvement, and make data-driven decisions. With customizable metrics, filters, and layouts, reports can be tailored to your needs and shared across your team for ongoing analysis.
Each supported report type includes default reports, which you can edit, delete, or add to.
Select a report from the list to display its data. To manage the criteria run within this report, select the Modify icon. Toggle on Advanced to view additional options.
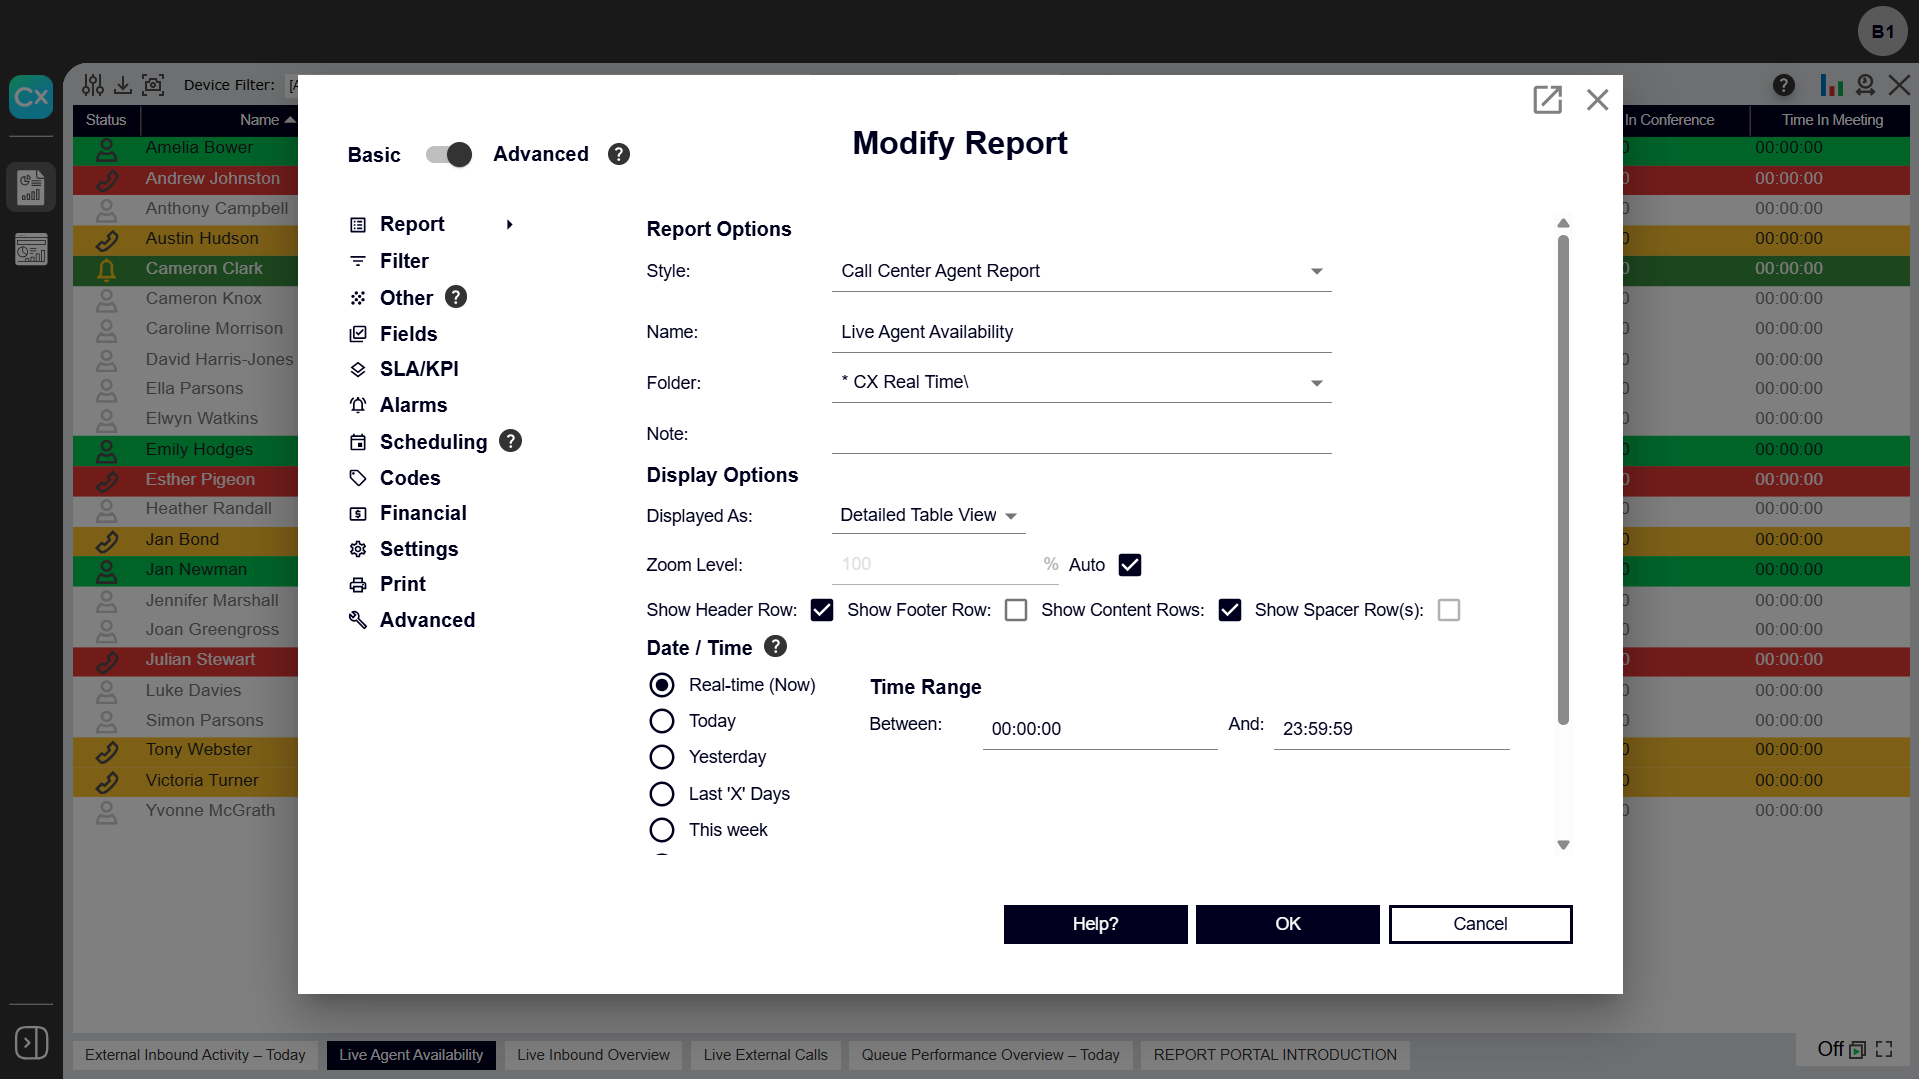
Here you can modify the following fields:
Note: The fields that can be modified are dependent on the report type.
- Report
- Style - Specifies what type of content data is displayed within the corresponding report when it is run. Style controls how the report is grouped.
- Interval - Only available for Interval reports. Choose your preferred interval — 15 or 30 minutes, 1, 2, 4, 8, or 12 hours, or day/week/month.
- Name - The default name of the report.
- Folders - How the report is organized in the report list.
- Note - Specify a comment or additional description for the report.
- Display Options - Choose how to display your report.
- Date/Time - Allows you to run the corresponding report for a fixed and custom date/time range.
- Filter - Specifies the filtering parameters the report is run against, such as devices and/or ACD agents.
- Other - Contains additional, but less commonly used filtering parameters.
- Fields - Configure the specific statistics or property columns to display within the report.
- SLA/KPI - Modify service-level settings and configure other calling-related options.
- Alarms - Used for report-style types that support alarms to turn report alarms on or off and configure time threshold values for when alarms are triggered.
Note: This tab is hidden when the corresponding report's date/time setting is selected to run across a duration other than Real-Time.
- Scheduling - Configure when the corresponding report automatically runs and is emailed to you.
- Codes - Specify the Agent Not-Available reason code used for calculating each of the statistic variants of total & average Not-Available Agent status time.
- Financial - Assign estimated monetary values to successful inbound and outbound calls, and set a call strike rate (calls per sale), to control how financial call statistics are calculated.
- Settings - Affect how inbound call statistics are calculated.
- Print - Configure display options for when the printable report and/or exported output is generated.
- Layout - For dashboards, configure how report tiles are arranged across tabs. The tab layout also determines the sheet order when the dashboard is exported to Excel.
- Advanced - Change parameters and settings for your report.
Note: Certain report styles can only be run when the current user is configured to allow the appropriate reporting license level. Additionally, the allowed report styles are also controlled by the selected telephone system(s) capabilities and partition(s) currently set against the corresponding report within the Filter tab. Report styles that are currently unavailable are shown with "(Unlicensed)" displayed after the report type's description.
7.
Manage folders
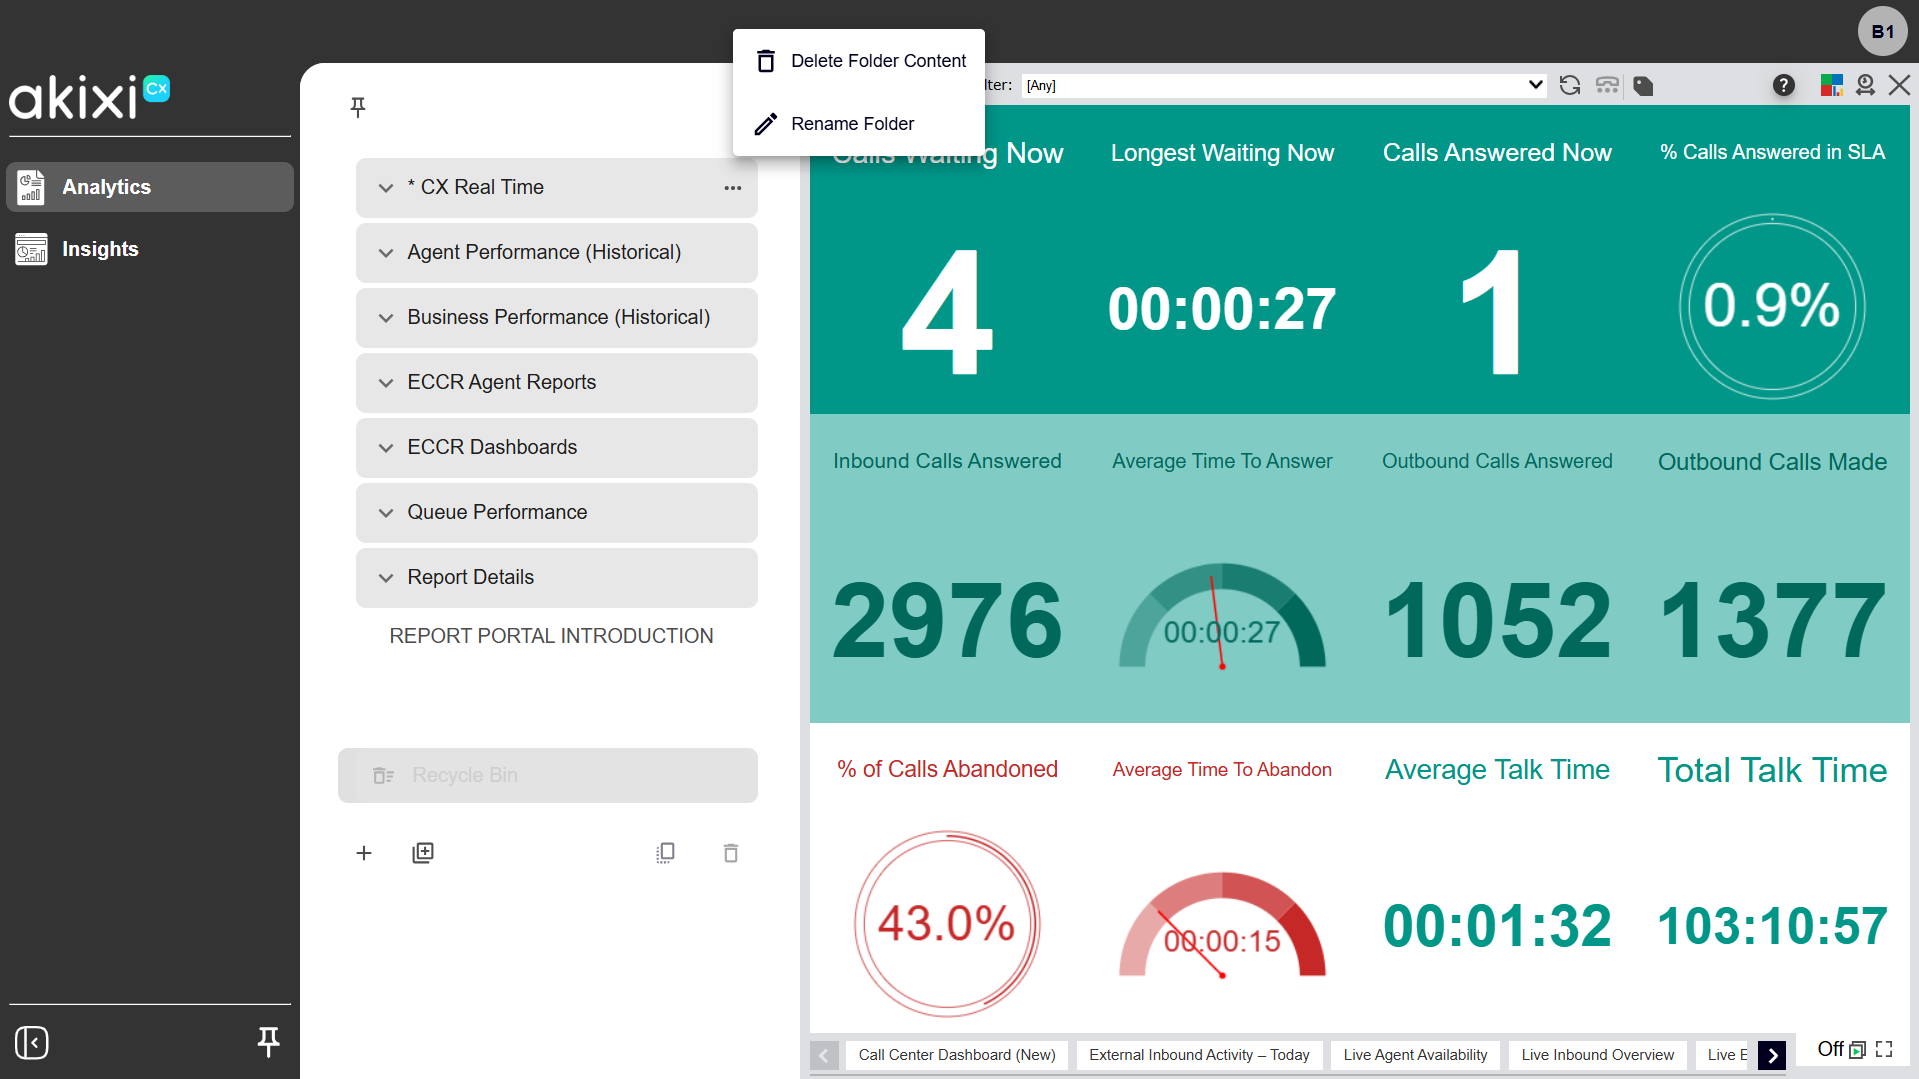
Organize reports into folders to keep your repository easy to navigate. You can create folders and move reports between them at any time.
To create a folder and add a report to it:
- Select the report, then select the Modify icon.
- In the Folders field, type a name for the new folder.
- Click OK. The report now appears under that folder.
To move a report to another folder, drag it from its current location and drop it onto the target folder. To move a report out to the main group, drag it back out.
8.
Filter reports by device type
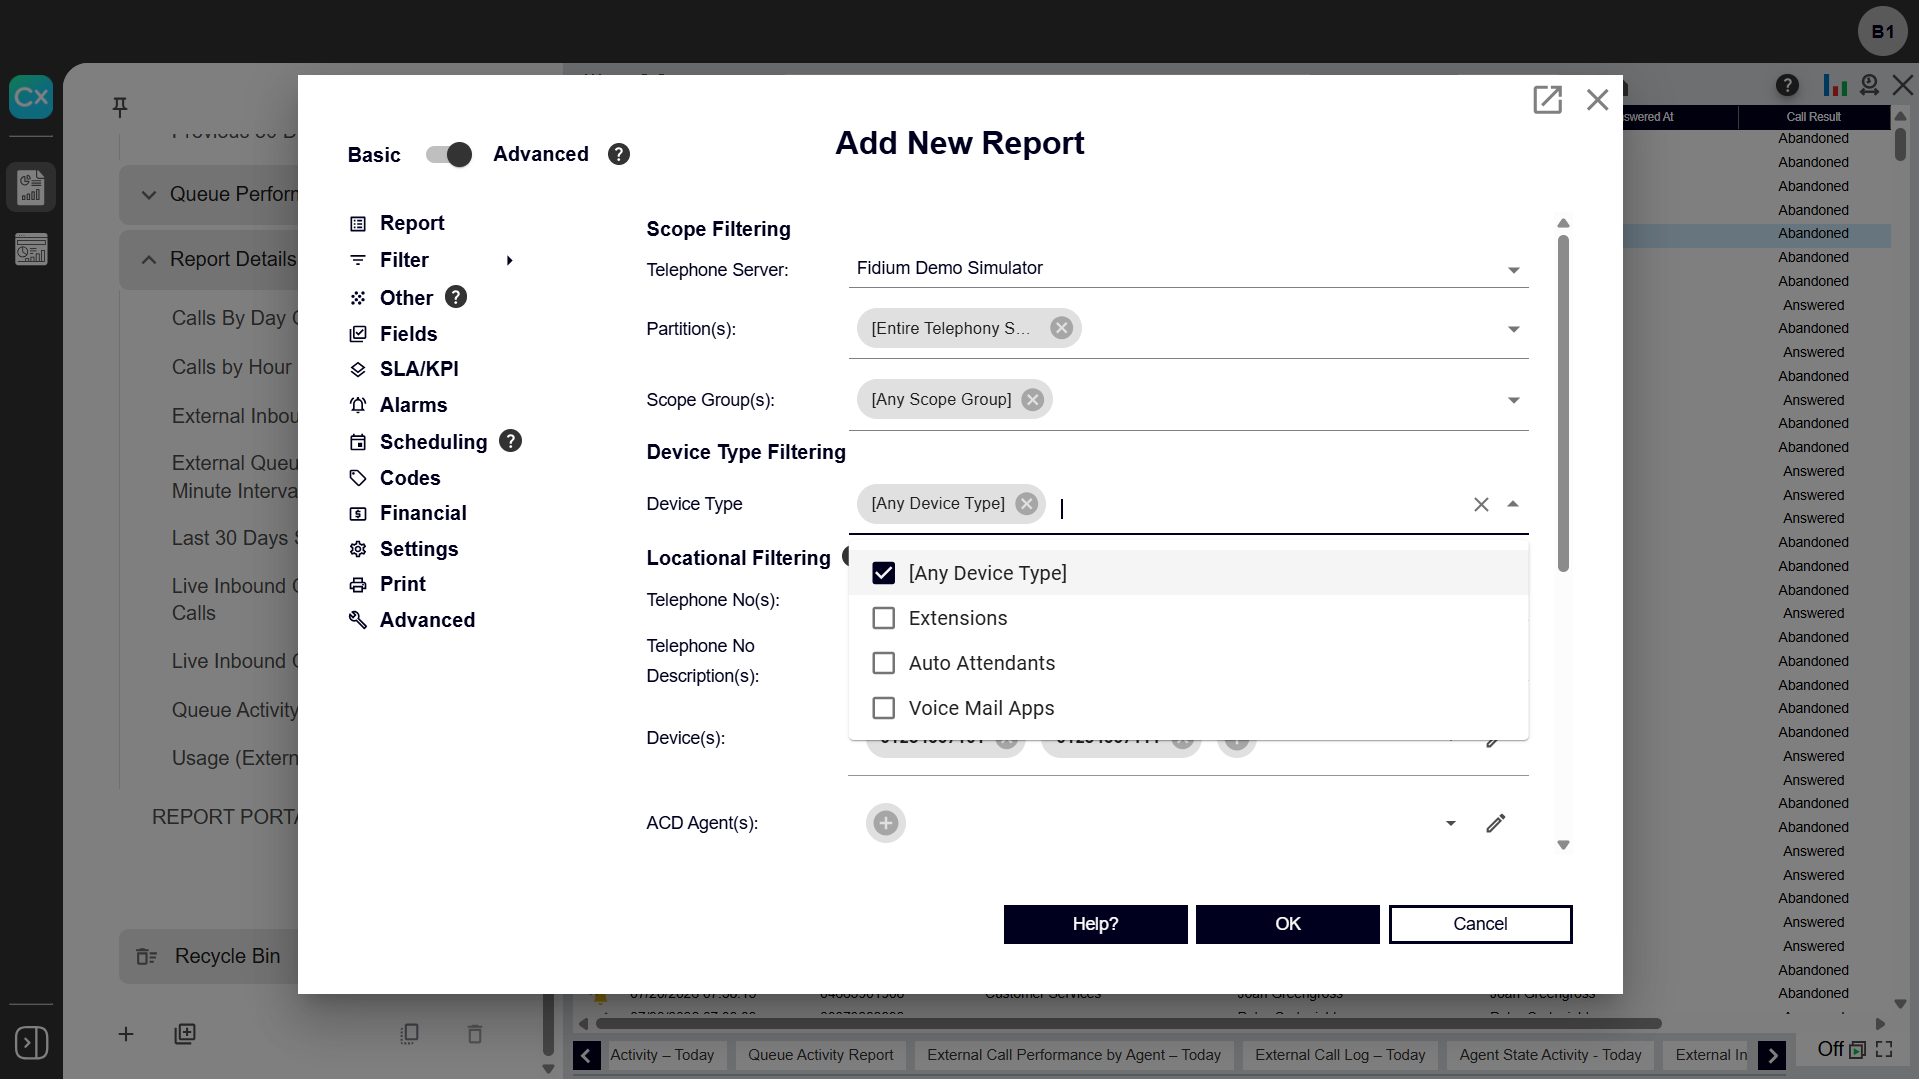
The Extension/Device Report can be filtered by device type — for example, showing only Auto Attendants, only standard Extensions, or only Voicemail Applications. This narrows a device report down to exactly the type of device being investigated, instead of scrolling through every device on the system.
To filter an Extension/Device report, follow these steps:
- Create a new Extension/Device report or select one to modify.
- In the report settings, toggle on Advanced.
- Select Filter.
- In Device Type Filtering, add the desired Device Types.
- Add additional filters and criteria as desired.
- Click OK.
When filtering a report, choose the field that matches what you're filtering on:
- Device(s) - Filter on queues, plain extensions, and other non-agent devices.
- ACD Agent(s) - Filter on call center agents (ACD contacts).
In either field, start typing a name or extension to search, then select from the matching results to add it. Add as many entries as you need.
Note: Auto Attendants are recognized as a device type, so you can report on call volume into an auto attendant. Reporting on which menu option a caller selected isn't directly available; contact your administrator if you need this level of detail.
9.
Configure SLA and KPI settings
Service-Level Agreement (SLA) and Key Performance Indicator (KPI) metrics provide a comprehensive view of your communication activity in both real-time and historical instances.
To configure SLA and KPI settings:
- Go to your desired report and select Modify Report.
- Toggle on Advanced settings.
- Click Fields to add and modify the metrics within the report.
- Click the add icon to add and remove report items as desired.
- Click OK to save.
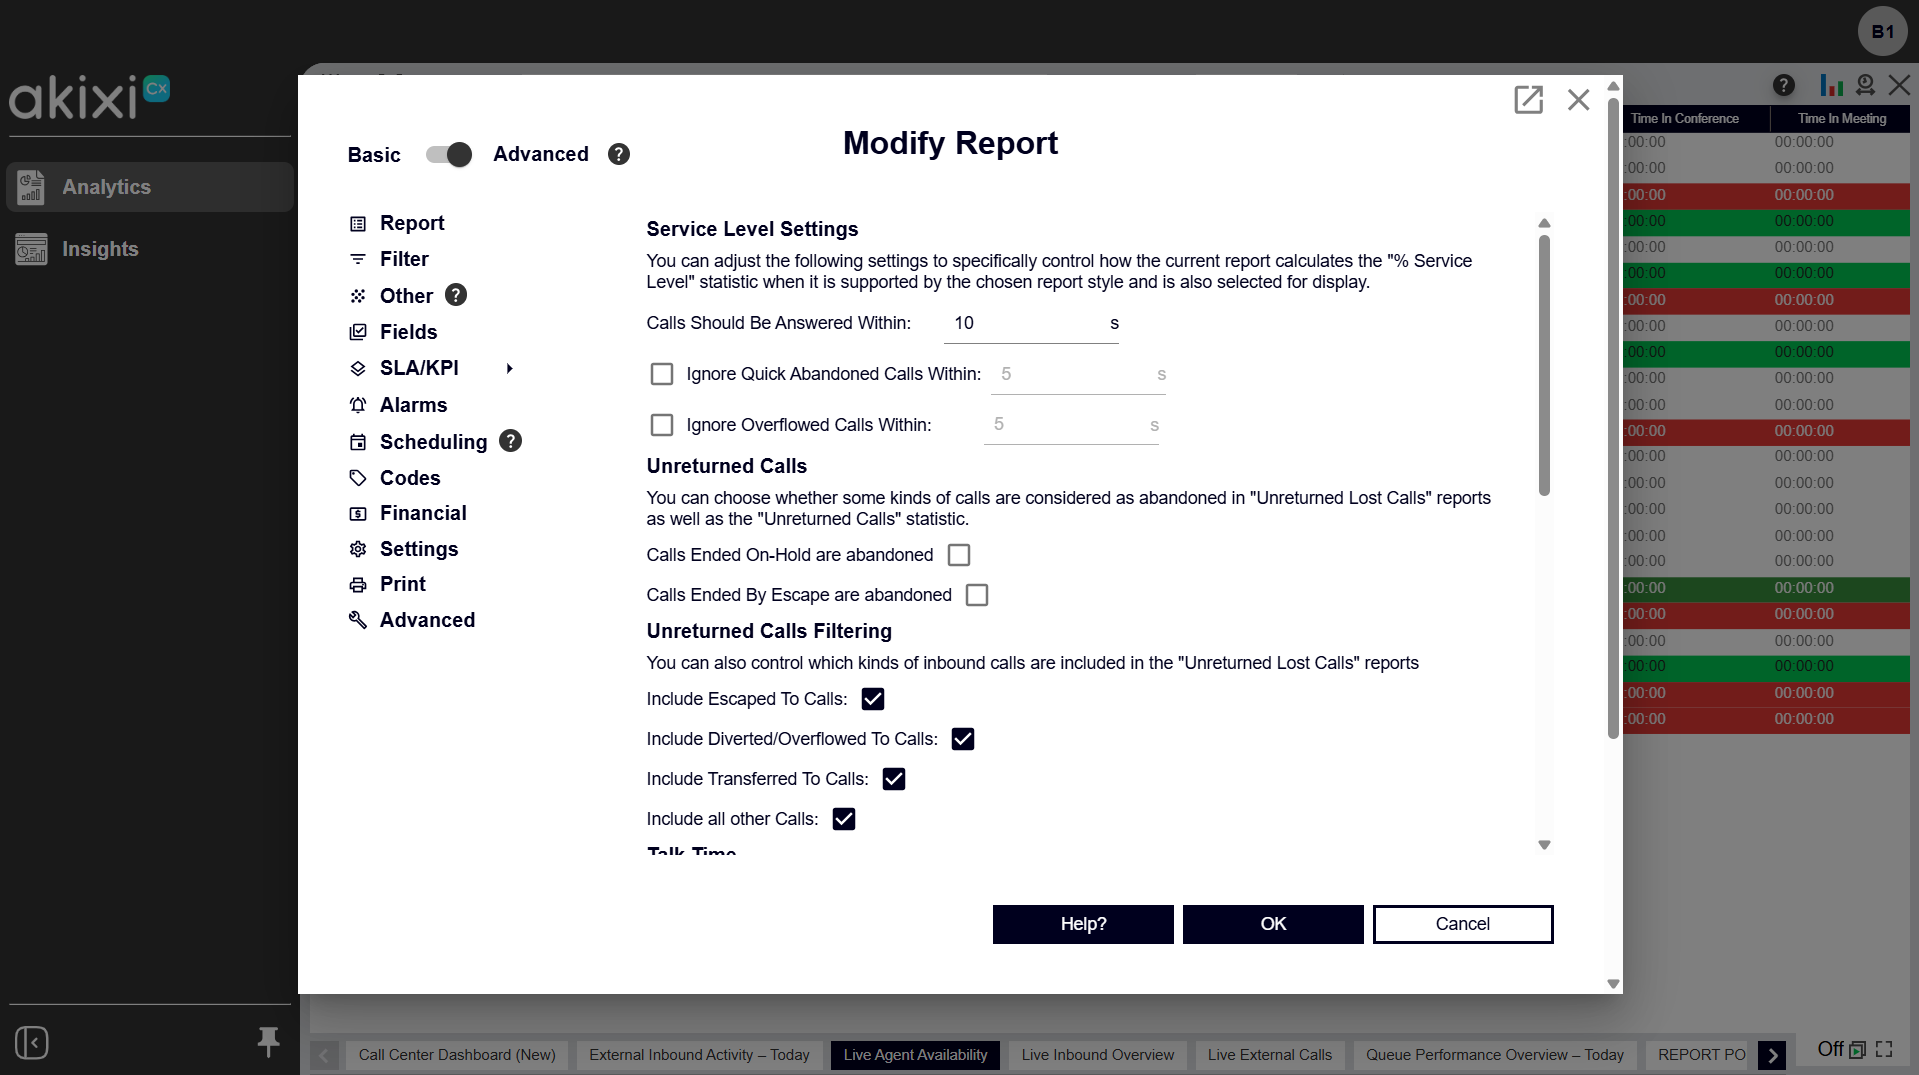
- Click SLA/KPI to manage performance metrics. Note: The SLA/KPI options available to modify vary depending on the report.
- Modify the Service Level Settings to control how the current report calculates the % Service Level statistic when selected for display.
- Choose what type of calls are considered Unreturned Calls in your reports and statistics.
- Choose whether the Talk Time statistic includes the held time of calls within its calculation.
- Configure the Inbound Statistic Settings to determine how current reports calculate inbound related call data.
- Adjust the Answer Performance fields to modify the answer duration thresholds for performance statistic variants.
- Use Abandoned Time Statistics to adjust the duration threshold used for inbound statistic variants.
- Click OK to save your SLA/KPI settings. The report updates to include the added SLA/KPI metric.
10.
Wallboards
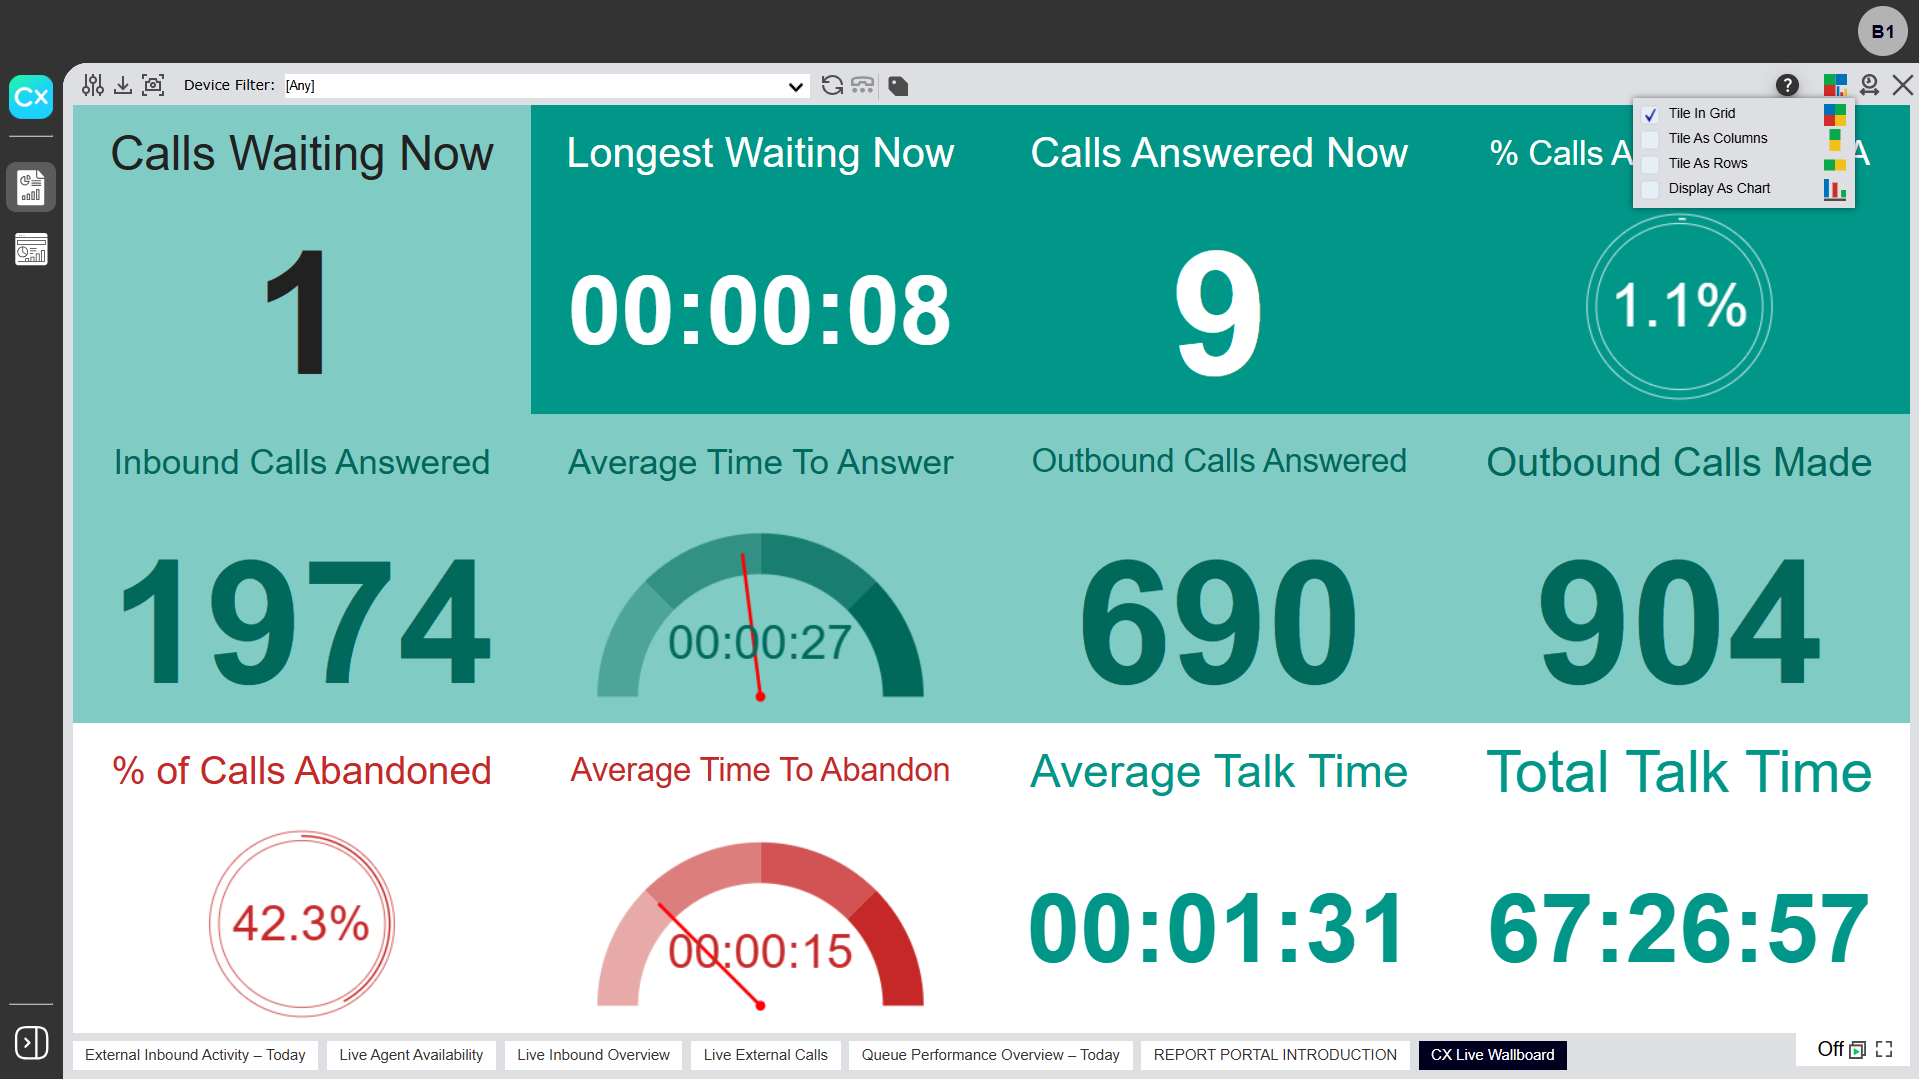
Wallboards display real-time statistics in large individual tiles, each with its own configurable alarm. They provide an at-a-glance summary of business or call center performance and are ideal for large-screen displays, keeping key call handling metrics visible to agents, team leaders, and managers. Hover over the title field in each tile for a brief description of what the tile is reporting on.
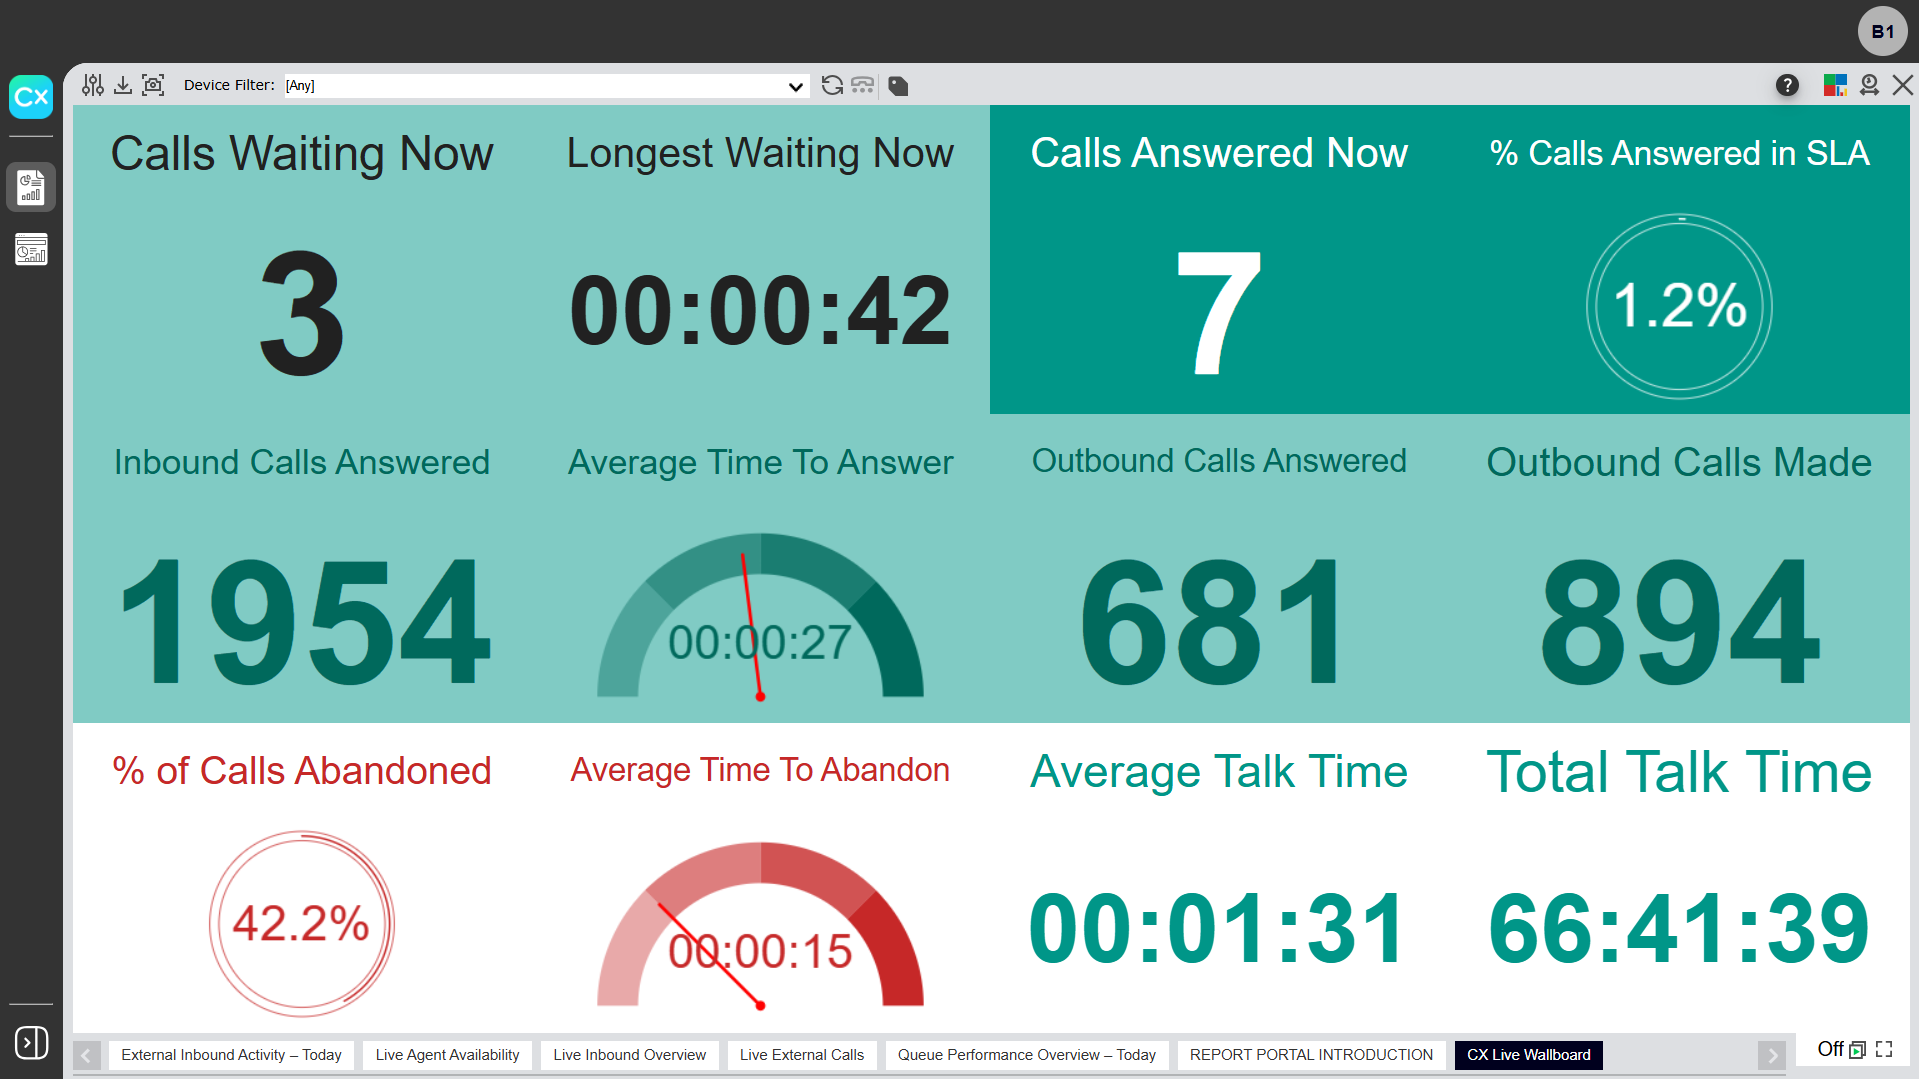
Use the tile arrangement button to select how wallboard tiles are displayed:
- Tile In Grid - Arrange sizes and all statistic tiles as a grid to fit within the available horizontal and vertical viewing area.
- Tile As Columns - Arrange all statistic tiles as a single horizontal row to fit within the available horizontal viewing area.
- Tile As Rows - Arrange all statistic tiles as a single stacked vertical column to fit within the available vertical viewing area.
- Display As Chart - Displays the corresponding wallboard report as a chart.
You can also customize the color of individual tiles. To recolor a tile, open the wallboard, select the tile you want to change, and set its background color. Your color choices are saved with the wallboard.
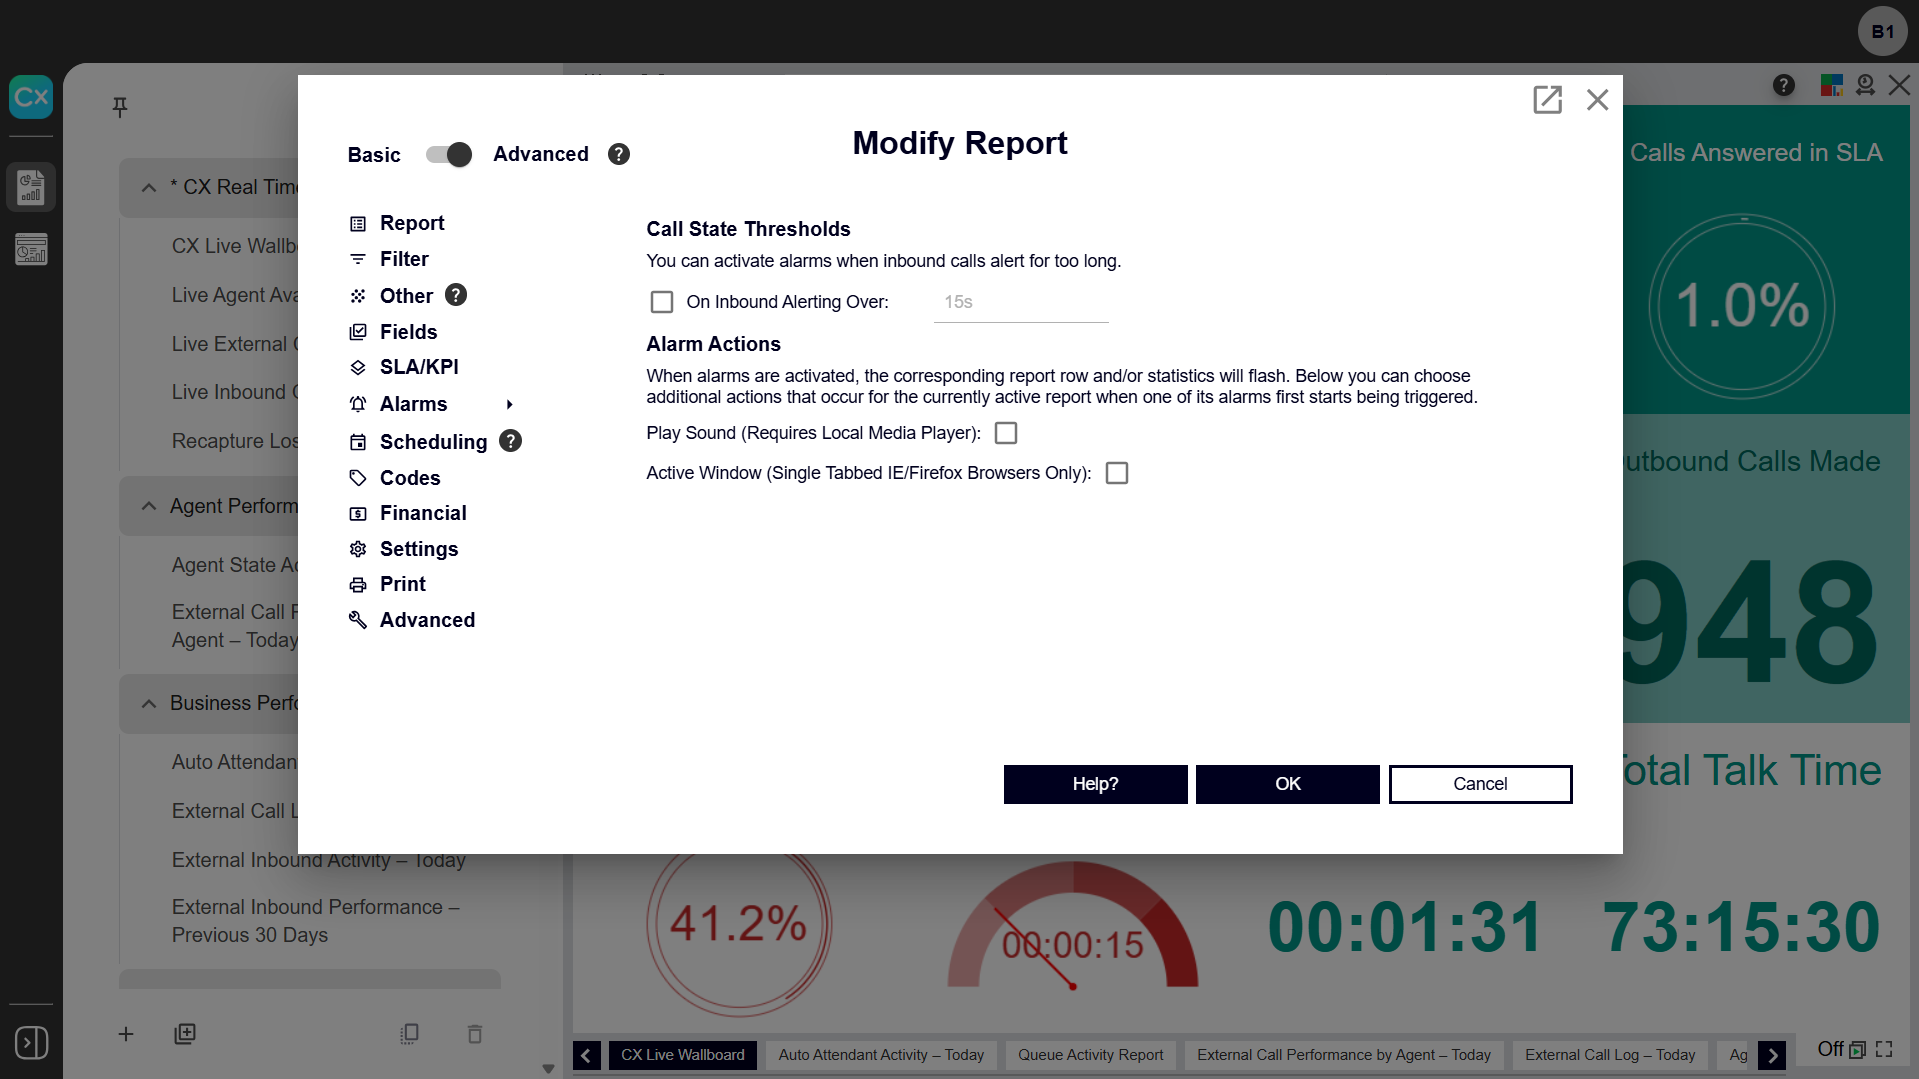
To configure wallboard alarms, follow these steps:
- Create a new Wallboard or select one to modify.
- In the report settings, toggle on Advanced.
- Select Alarms.
- Set your alarm preferences.
- Click OK.
11.
Call Journey
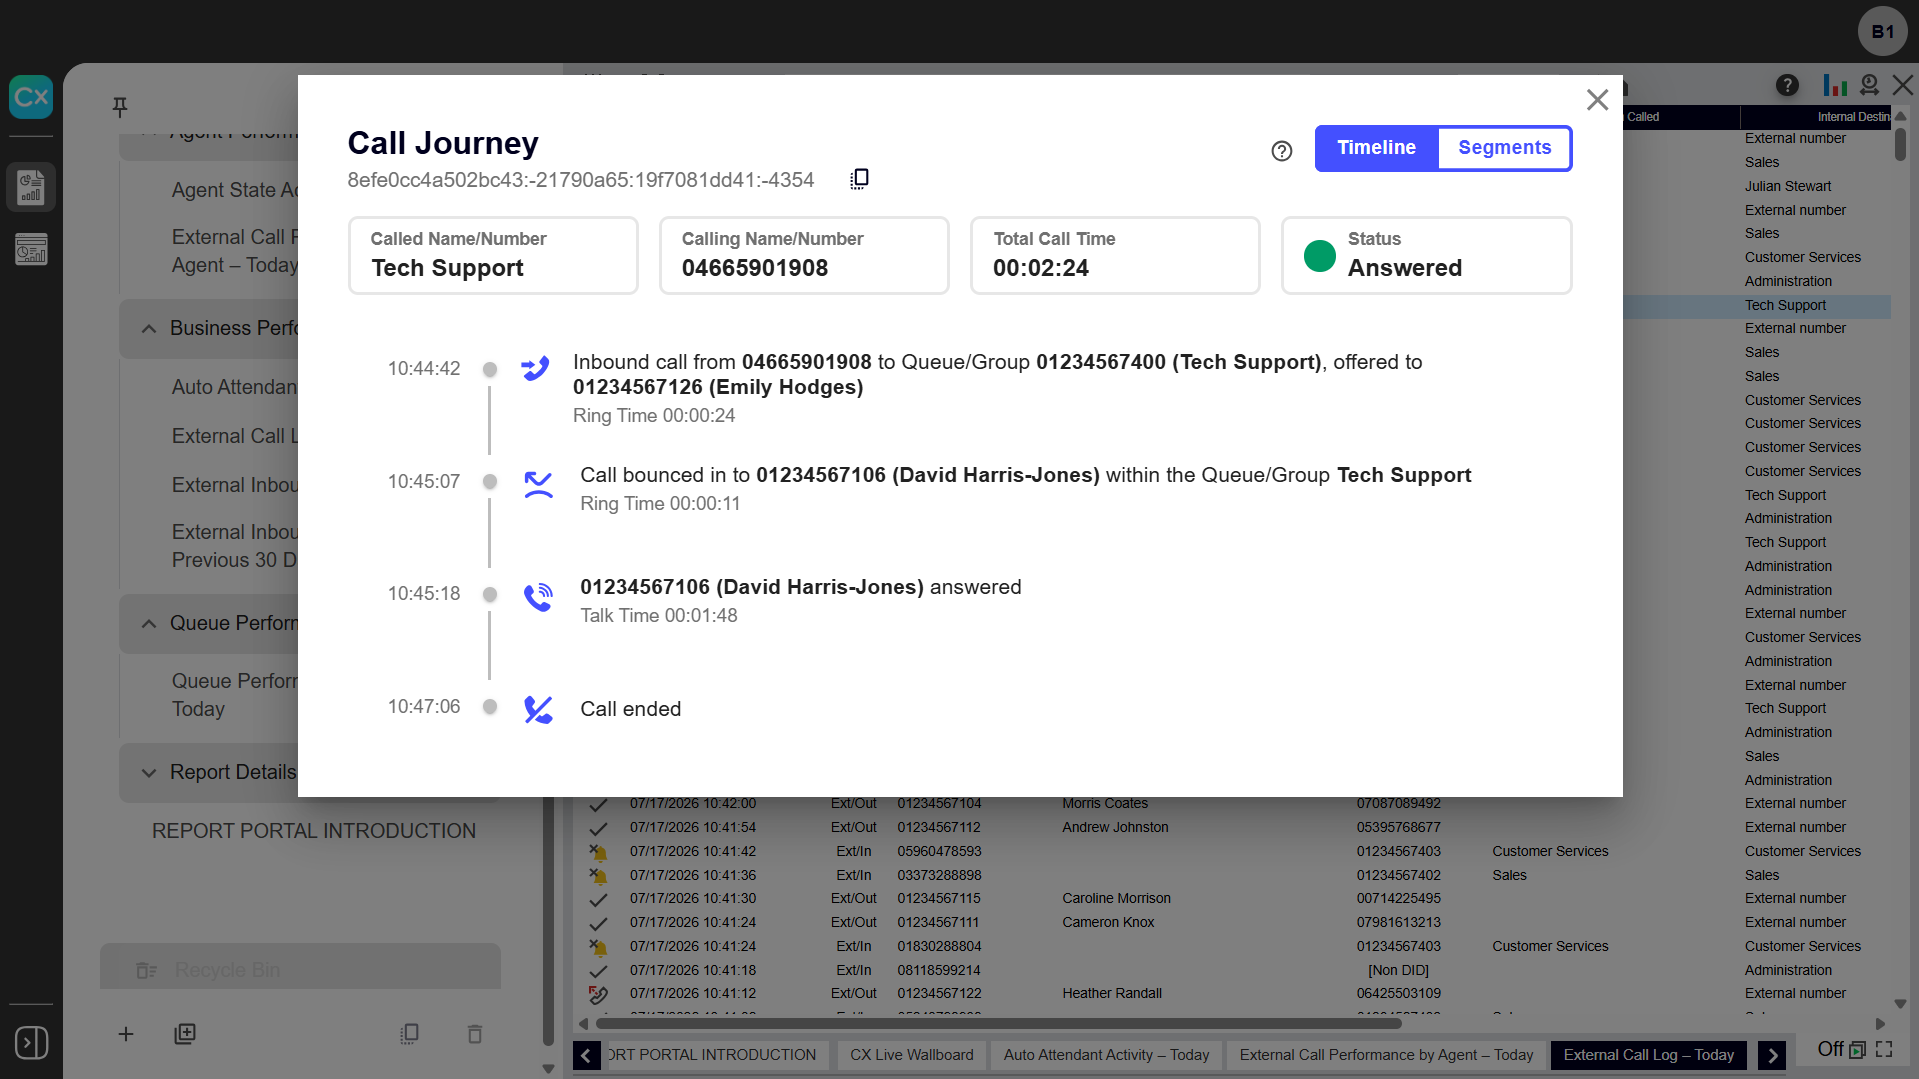
Call Journey displays a time-stamped visual map of everything that happened during a call — who called, who answered, wait times, holds, and transfers. It presents the entire call journey in a single view, making it faster to investigate a specific call or complaint without piecing together details from multiple report columns.
To access a Call Journey for a call:
- Click on any call record in the Historic Call Log, Unreturned Lost Calls, Active Call List, or Agent/Extension Report.
- You can switch between the new Timeline view or the classic Segment view at any time.
12.
Export reports
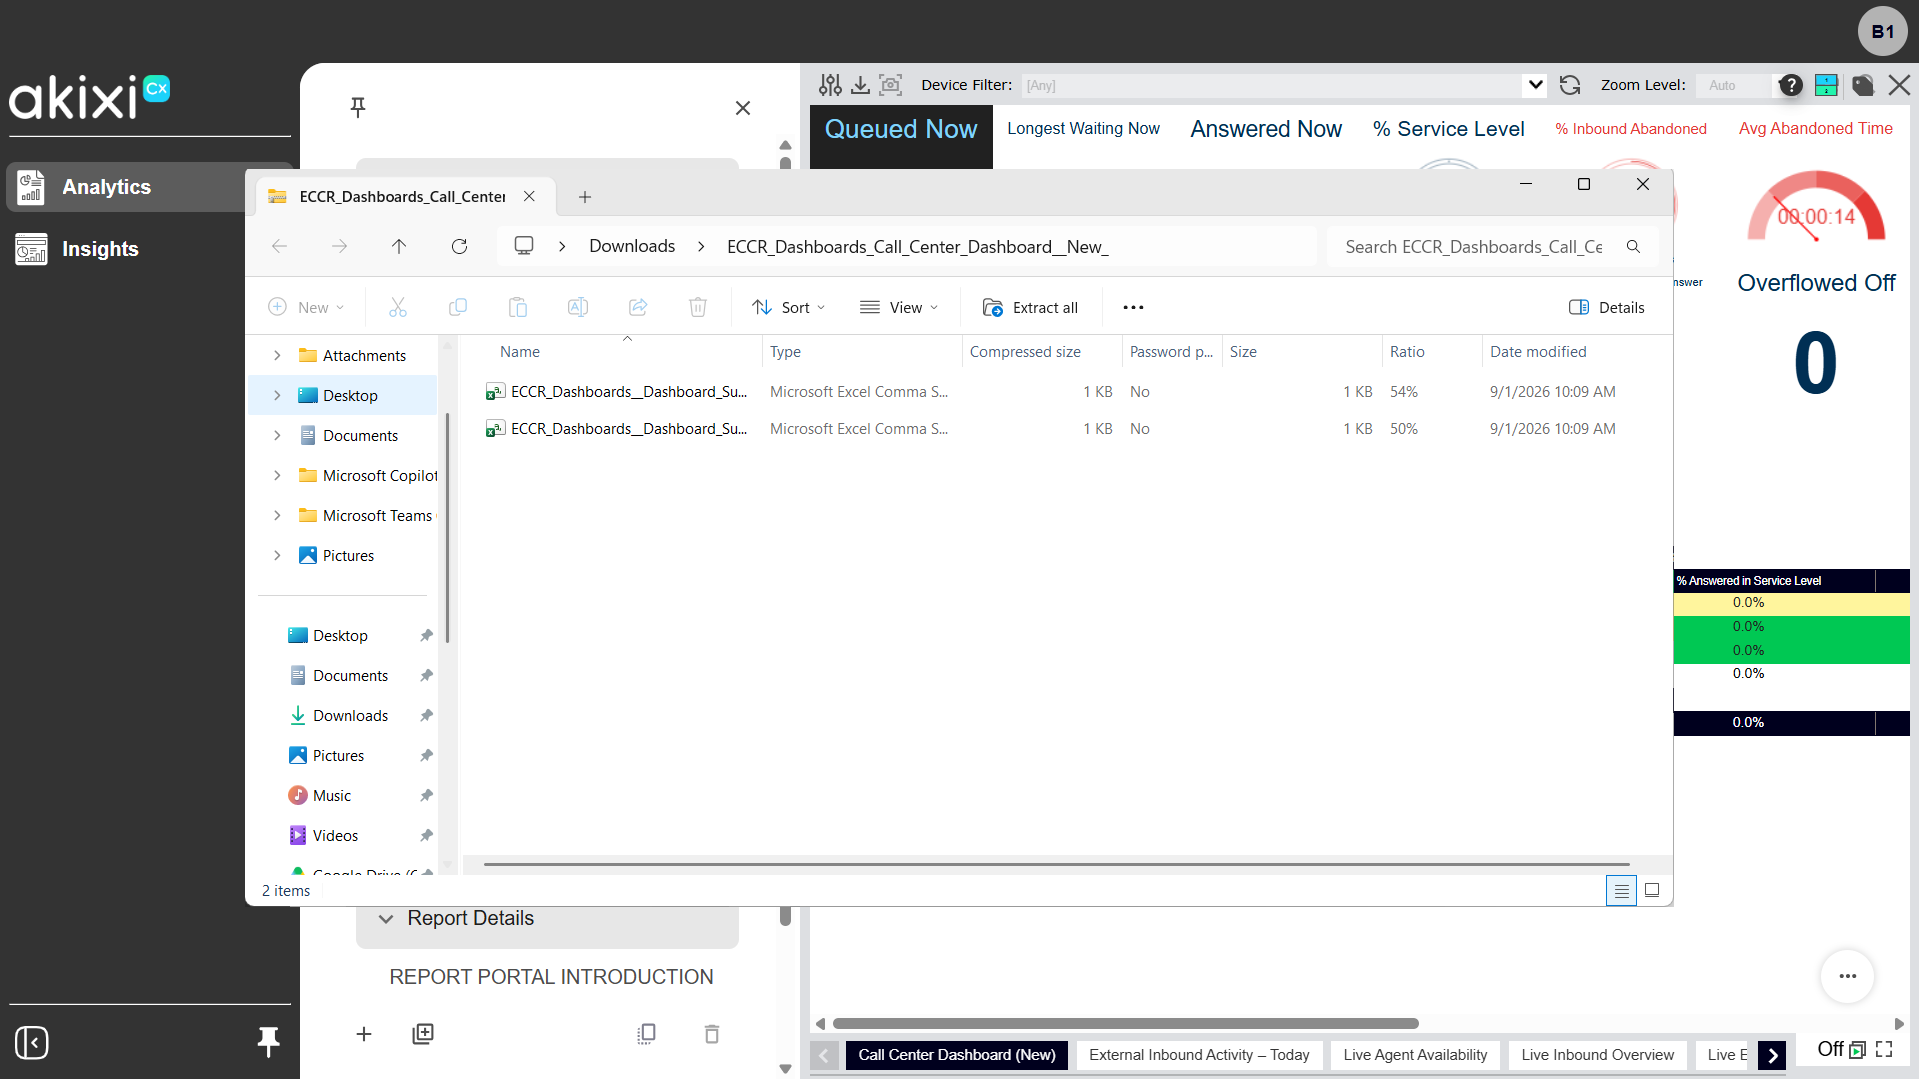
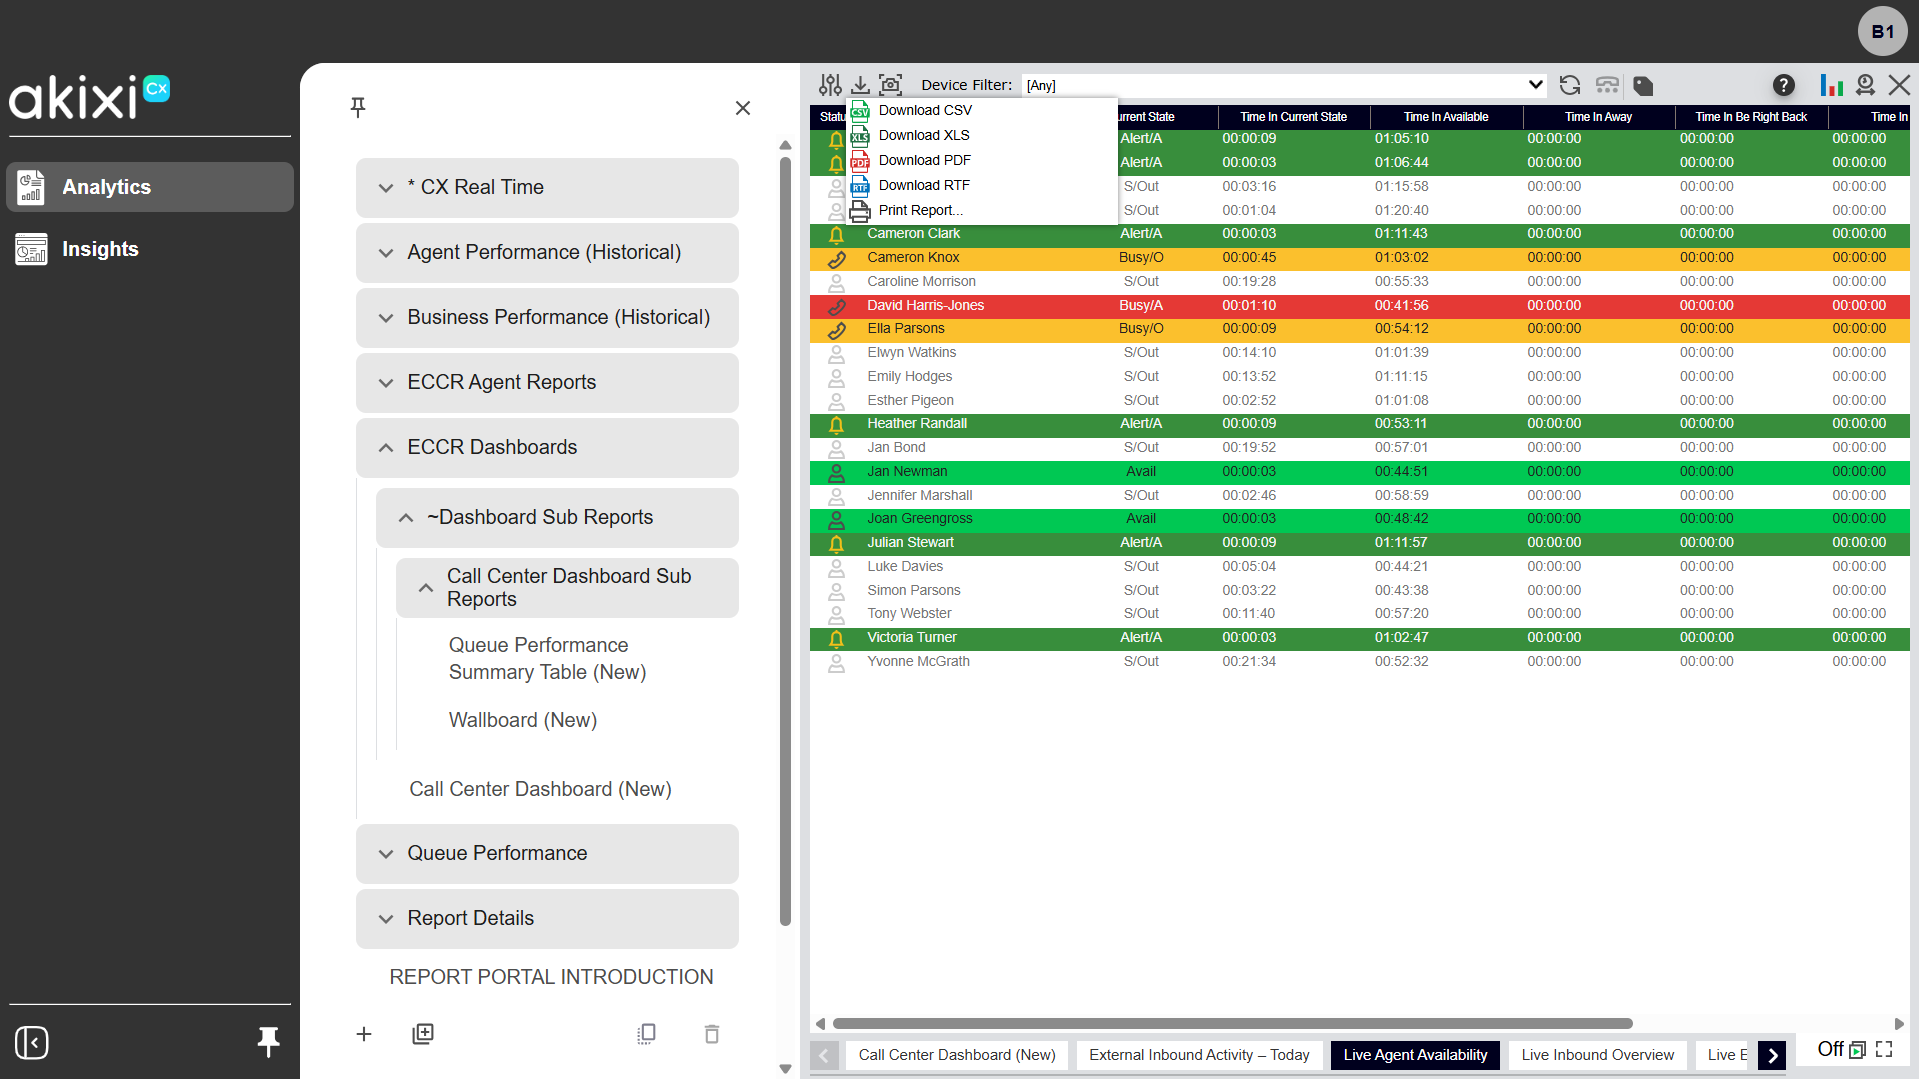
Entire dashboards can be exported in a single action, and individual reports can be downloaded, exported, or scheduled directly to an XLS (Excel) file.
For dashboard exports, XLS places each report on its own sheet within one file — following the dashboard's tab layout, so the report in Tab 1 becomes the first sheet, Tab 2 the second, and so on. PDF combines every report into a single document, and CSV or RTF bundles the individual reports into a zip file.
To export a dashboard:
- Open the dashboard you want to export.
- Select Export.
- Choose your preferred format (XLS, PDF, CSV, or RTF).
To export a single report to XLS:
- Open the report you want to export.
- Select Export, then choose XLS as your format.
13.
Schedule reports
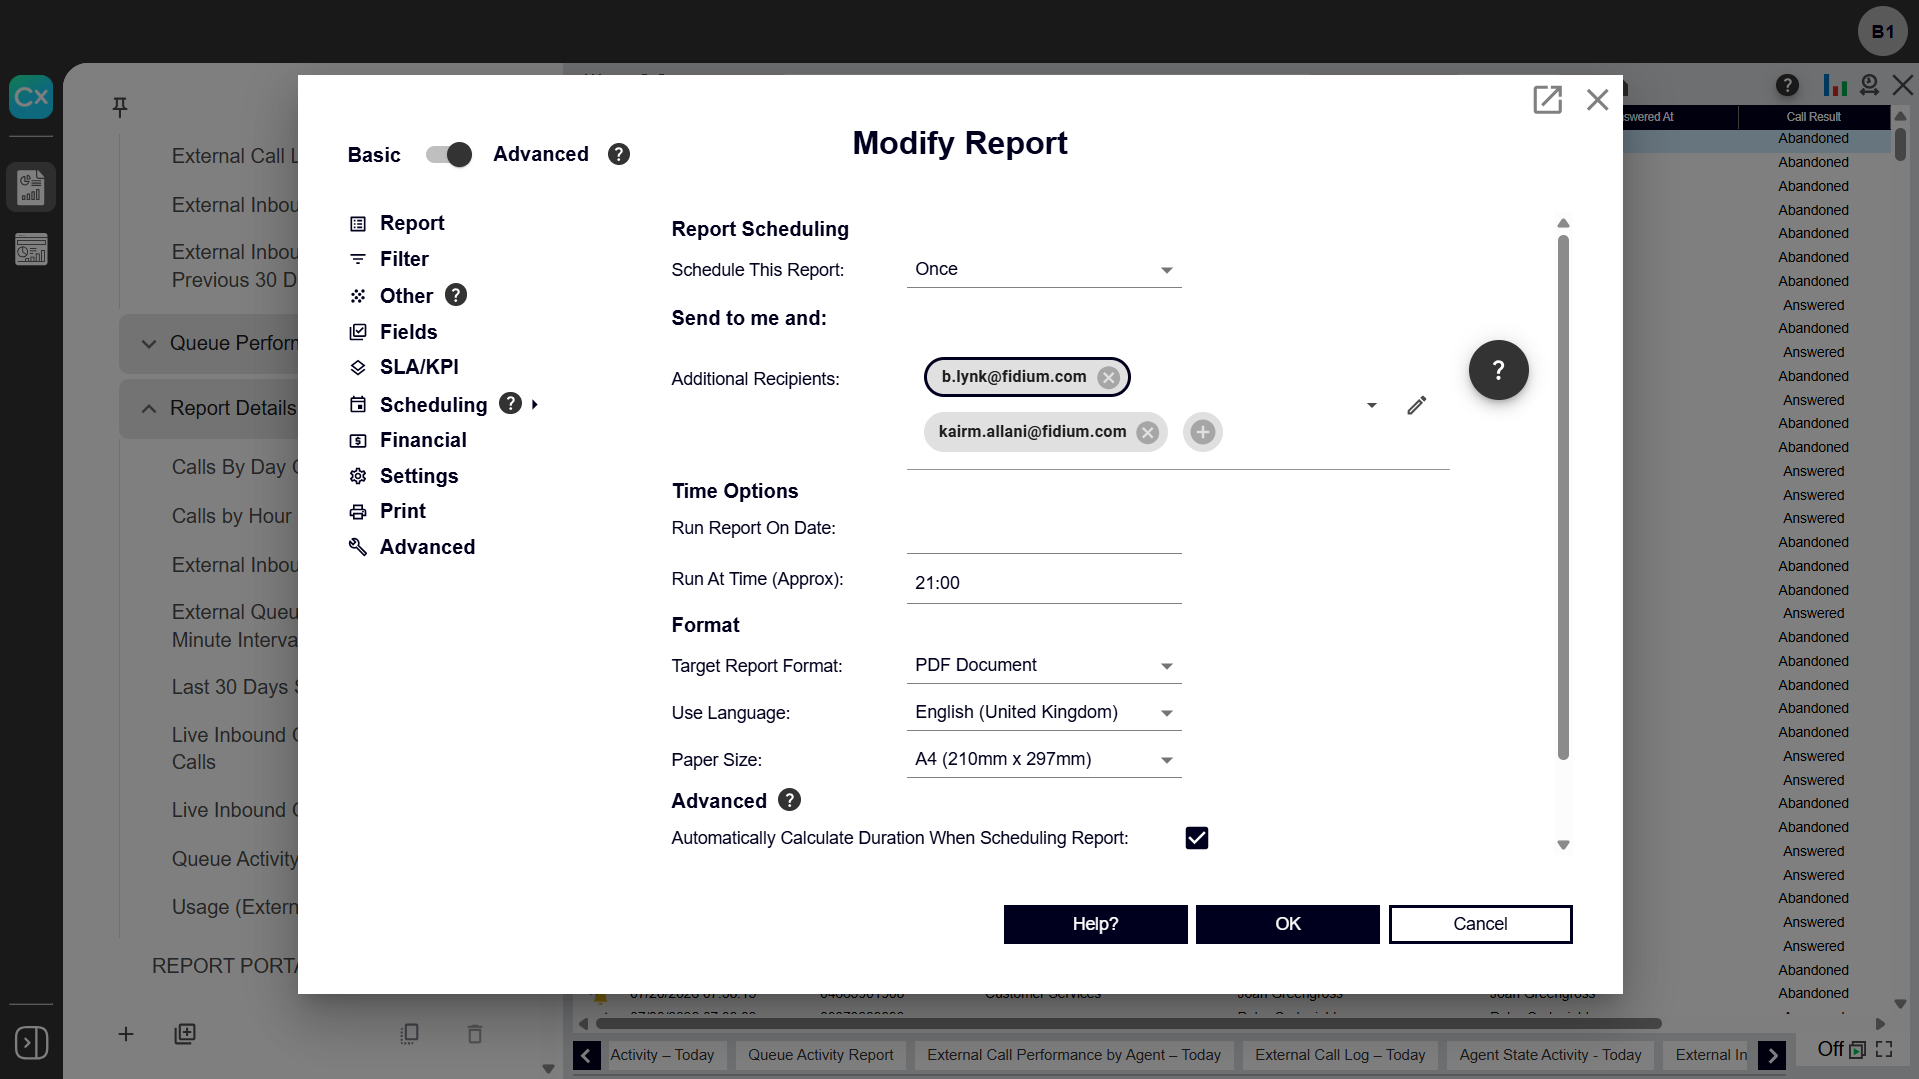
Scheduled reports can now be emailed to up to 20 recipients at once, including up to 10 recipients without an Akixi login, as long as their email addresses match your organization's domain. This keeps the whole team automatically up to date without the need to manually forward report emails.
To schedule a report:
- Create a new report or select one to modify.
- In the report settings, toggle on Advanced.
- Select Scheduling.
- Set the Report Scheduling frequency.
- Add Recipients. Selected users appear as a gray bubble. Non-user email addresses contain a black border for easier differentiation.
Note: This feature isn’t available for CME reporting users.
- Configure additional settings as desired.
- Click OK.